
Release of the Madison River from Ennis Lake dam and powerhouse near Ennis, Montana. Photo courtesy of Scott Bischke.
Key Messages
Trends at weather stations and streamgages show that temperature has risen, snowfall has declined, and peak streamflow has shifted earlier into the spring in the GYA’s watersheds since 1950.
-
Meteorological records, averaged across the GYA, show that the mean annual temperature in the GYA has increased by 2.3°F (1.3°C) at a rate of 0.35°F (0.19°C) per decade. [high confidence]
-
Average precipitation across the GYA has not changed significantly and remains near 15.9 inches (40.5 cm) with year-to-year variability of 2.2 inches (5.6 cm) based on the standard deviation of the meteorological record average. [high confidence]
-
Average annual total precipitation has remained near 15.9 inches (40.5 cm), but precipitation has increased in spring and fall, by 17-23% in April and May and 42% in October. It has declined by 17 and 11% in June and July, respectively. [high confidence]
-
As the climate has warmed, mean annual snowfall in the GYA has declined by 3.5 inches (8.9 cm) per decade [medium confidence]. Much of the snowfall decline occurred in spring when warming was greatest [high confidence].
-
Annual streamflow today is similar to that of the mid-20th century, but on average over the GYA the timing of peak flow has shifted earlier in the year by 8 days (range of 1-15 days in the HUC6 watersheds), extending the length of the water-limited warm season. [high confidence]
Introduction
In this chapter we examine recent climate and hydrologic trends in the GYA as recorded by observations at weather stations and streamgages. The trends parallel climate and hydrological changes that have occurred in recent decades throughout the western United States. Instrumental records from across the western states show that rising mean annual temperature has reduced snowpack (Mote et al. 2018; Milly and Dunne 2020), increased winter rainfall (Knowles et al. 2006; Klos et al. 2014), diminished the volume of snowmelt, pushed the timing of peak streamflow earlier in the year (Stewart et al. 2005; Moore et al. 2007; Udall and Overpeck 2017), and enhanced evaporation (Golubev et al. 2001; Brutsaert 2006; Milly and Dunne 2020). Collectively these observations confirm that even a modest rise in temperature is already transforming the hydrology of the West.
Previous work in the GYA shows similar trends, which we examine here in detail. GYA temperatures have risen (Chang and Hansen 2015), the amount of snowmelt has declined (Tercek et al. 2015), and summer streamflow has diminished (Leppi et al. 2012). Important watershed differences that may modulate the response to warming include topography and elevation (Chang and Hansen 2015), atmospheric circulation (Whitlock and Bartlein 1993), and vegetation (Romme and Turner 1991) owing to their potential influence on weather patterns and the distribution of moisture.
We examine the climate and hydrologic trends by season, location, and elevation in the GYA over the last century, particularly since 1950. We describe historical trends based on a network of weather and hydrological stations across the region, focusing on changes in the HUC6 watersheds, as defined in Chapter 1, and at different elevations.
Important watershed differences that may modulate the response to warming include topography and elevation (Chang and Hansen 2015), atmospheric circulation (Whitlock and Bartlein 1993), and vegetation (Romme and Turner 1991) owing to their potential influence on weather patterns and the distribution of moisture.
Data Sources
Reasons for selection
To compile meteorological data across the United States, the National Weather Service established its Cooperative Observer Network in 1890 (National Research Council 1998). For GYA watersheds, the greatest number of those weather stations making continuous measurements were established after World War II (Fiebrich 2009). Thus, for this analysis we use temperature, precipitation, and snowfall data recorded since 1950 at weather stations in the GYA.
To compile streamflow data, the USGS began installing streamgages across the United States as early as 1889 and on key GYA rivers and tributaries beginning in the 1890s (Eberts et al. 2018). Given these earlier installations, we consider GYA streamflow data since 1925 in this analysis, which provide records from the 1930s Dust Bowl drought for context.
Based on these long-term data sources, our analysis reveals historical trends from 43 weather stations (Table 3-1) and 17 streamgages across the GYA in Wyoming, Montana, and Idaho at elevations from 4000-8000 ft (1200-2400 m) (Figure 3-1). The absence of long-term weather records from above 8000 ft (2400 m) limits our understanding of how the GYA’s climate and hydrology have changed, particularly the relationship of snowfall to runoff because much of the snowpack in the GYA falls at the highest elevations. Other types of records, such as automated SNOTEL weather stations, manual measurements from snow courses, and gridded climate data sets that interpolate observations to areas without direct measurements (e.g., the widely used PRISM Climate Group’s gridded climate products, see Figure 2-5) provide high-elevation records but cover only the past few decades. They may also measure other weather variables, like snow depth, that are not directly comparable with measurements from the Cooperative Observer Network, like snowfall, or may be sampled too infrequently to determine seasonal trends. Here we focus on the Cooperative Observer Network stations because the data are direct measurements that extend continuously to 1950.
Avoiding data biases
Site-specific biases, such as observer practices and instrumentation, can affect individual measurements at a station (Mahmood et al. 2006; Pielke et al. 2007), and average trends spanning multiple stations over decades are considered more accurate (Fall et al. 2011; Shuman 2012). To ensure the reliability of the historical records, we used only the most complete monthly and annual data sets from 1950 through 2018, specifically those with fewer than 5 days of observation missing in any month. This constraint reduces the number of records but ensures that all trends are well documented and not influenced by changes in the number of stations used. When we refer to average conditions, we use 1950-2018 as the base period for the meteorological data and 1925-2018 as the base period for hydrological data.


Figure 3-1. Location of National Weather Service (NWS) weather stations (red +) and USGS streamgaging stations (blue triangle) that provided the meteorological and streamflow records used in our analysis. We examine weather station data back to 1950 and streamflow data back to 1925.
Historical Climate Changes in the GYA
Below we describe the historical patterns of average temperature, precipitation, and snowfall across the GYA that account for varying elevation and location of the HUC6 watersheds. We also analyze how these patterns are changing for the GYA as a whole, by elevation, and by watershed. We first address annual trends, then examine monthly trends.
Geographic patterns of average temperature, precipitation, and snowfall
Since 1950, weather stations above 7000 ft (2100 m) have recorded the lowest annual average temperatures (Figure 3-2). This observation is expected as temperature generally decreases with increasing elevation. Some exceptions to this generalization arise, however, due to the north-south distribution of station locations in the GYA (Figure 3-1). Weather stations located in the southern part of the GYA between 5000-6000 ft (1500-1800 m), the second-lowest elevation range in Figure 3-2, have frequently recorded the highest annual temperatures and lowest total precipitation.

Figure 3-2. Mean annual temperature, total precipitation, and snowfall trends for the Greater Yellowstone Area (GYA) since 1950, shown by elevation. Each dot in the plots represents the mean annual value of all sites within the indicated elevation bands where long-term weather station records exist. The first (grayed) column is the average over all elevation bands. (No long-term weather stations are located above 8000 ft, see Figure 3-1). The black lines are LOESS regressions fit to the point data and the gray shading indicates the 95% confidence level around the LOESS lines. The LOESS fits highlight trends in the data.
The amount of snowfall also changes with elevation and temperature (Figure 3-2). Like most of the mountainous West, annual precipitation totals in the GYA tend to be greater at high elevation than at low elevation. Snowfall accumulates above 7000 ft (2100 m) because it is colder there than at lower elevations, where temperatures consistently average above freezing—greater than 35°F (1.7C°).
Temperatures below 6000 ft (1800 m) exceed those above 7000 ft (2100 m) by roughly 10°F (6°C), so less precipitation falls as snow below 6000 ft. The historical data show that weather stations below 6000 ft (1800 m) rarely have received more than 75 inches (190 cm) of snow annually, but twice that amount has fallen annually when averaged across stations above 6000 ft (1800 m) (Figure 3-2). The greatest snowpack accumulation recorded by the weather stations examined here occurs between 7000 (2100 m) and 8000 ft (2400 m), where snowfall has exceeded 150 inches (380 cm) six times in the last 70 yr.
Distinct climate trends arise throughout the GYA due to the topography and position of each of the six HUC6 watersheds (Figure 3-1). Weather stations in the Big Horn watershed, where low-lying plains surround the mountainous terrain of the Shoshone National Forest, often record the highest average annual temperatures in the GYA (top row, Figure 3-3). Temperatures in the Upper Green and Snake Headwaters watersheds, which include high-elevation areas in the Wind River Range, are typically the coolest. Since 1950, total precipitation has often been highest in western watersheds, which are maximally exposed to winter storms derived from the Pacific Ocean. For this reason, maximum annual snowfall frequently develops over the cold, high elevations in these western GYA watersheds, particularly the Snake Headwaters and Upper Snake watersheds (bottom row, Figure 3-3).

Figure 3-3. Annual temperature, total precipitation, and snowfall trends for the Greater Yellowstone Area (GYA) and Hydrologic Unit Code 6 (HUC6) watersheds since 1950. Each dot in the plots represents the mean annual value. The black lines are LOESS regressions fit to the point data and the gray shading indicates the 95% confidence level around the trend LOESS lines. The LOESS fits are used to highlight trends in the data.
Annual variability and trends in GYA climates by elevation and watershed
Climate change since 1950 has modified the geographic patterns described above. Temperatures in the GYA have risen 2-5°F (1.1-2.8°C) since 1950 across all elevations below 8000 ft (2400 m) where weather station data are available (Figure 3-2, top row). The trends are large relative to interannual variability, typical warm or cold year departures from the average, of 1.3°F indicated by the standard deviation of the GYA mean annual temperature since 1950.
Average annual total precipitation has remained near 15.9 inches (40.5 cm), but the GYA has experienced year-to-year precipitation variability of 2.2 inches (5.6 cm) based on the standard deviation of the meteorological record average (Figure 3-2, middle row).
The regional gradients in temperature, precipitation, and snowfall at different elevations and in different watersheds also have changed since the 1950s, as demonstrated by the following examples:
-
Changing annual temperature patterns include:
- Temperatures above 7000 ft (2100 m) elevation now approach those commonly recorded between 6000-7000 ft (1800-2100 m) elevation in the mid-20th century (top row, Figure 3-2).
- Mean annual temperatures in the Missouri Headwaters and Upper Snake watersheds are now similar to those in the Big Horn watershed, which, historically, was the warmest subregion of the GYA (Figure 3-3).
-
Changing annual snowfall and precipitation patterns include:
- Snowfall has declined, despite stable precipitation totals, such that the 6000-7000 ft (1800-2100 m) elevation band no longer yields the greatest average snowfall (bottom row, Figure 3-2).
- Declining snowfall is most apparent in the Snake Headwaters watershed, where total precipitation has increased but total snowfall has declined to equal mid-20th century totals in the less snowy Upper Snake watershed to the west (Figure 3-3, middle and bottom rows).
- Overall, as temperatures across the GYA in 6000-7000 ft (1800-2100 m) elevation range have increasingly exceeded freezing, snowfall has declined (Figure 3-2).
- Snowfall is now highest above 7000 ft (2100 m) elevation, where total precipitation has increased by approximately 5.0 inches (13 cm) since the 1990s (Figure 3-2), even though the mean temperatures at these elevations have also risen by 2.5°F (1.4°C) since the 1980s. As temperatures increase above freezing, the snowfall increase has leveled off despite continued increases in precipitation (Figure 3-2).
Monthly variability and trends for the full GYA
GYA’s hydrological resources depend on seasonal dynamics that influence the storage and transport of water across the landscape. Thus, we next discuss changes in the monthly trends of temperature, precipitation, and snowfall to reveal important seasonal differences in climate not apparent in the annual trends of individual watersheds discussed above.
The availability of water shifts seasonally due to the annual cycle of precipitation and temperature (see Chapter 2). During the warmest months of the year, July and August, precipitation is readily accessible for use by plants, animals, and communities, but the water is also more easily evaporated than in cooler seasons, making the storage potential for runoff comparatively low. Heavy snowfall received during the coldest months—December through February—stores vast amounts of water, but plants, animals, and communities must wait until spring melt to access it. Warm springs or falls extend summer conditions and decrease local water storage in two primary ways: by increasing evaporative water loss and by decreasing the amount of precipitation that falls as snow. Such changes cause seasonal water availability to shift with significant consequences for other natural resources by altering factors such as the length of the growing- and fire-seasons by changing seasonal exposure to drought or extreme winter conditions.
The dots in Figure 3-4 show the average temperatures, precipitation totals (rainfall plus the amount of water contained in snowfall), and snowfall totals averaged across GYA for each month since 1950. The line in each panel shows the long-term trends based on averaging over the different decades, and the gray band shows the likely range (uncertainty) of the trend.

Figure 3-4. Monthly temperature, total precipitation, and snowfall trends for the Greater Yellowstone Area (GYA) since 1950. Each dot in the plots represents the mean value of all sites within the GYA. The black lines are LOESS regressions fit to the point data and the gray shading indicates the 95% confidence level around the LOESS lines. The LOESS fits illustrate trends in the data. The high variability of snowfall from year to year indicated by the wide shaded bands makes those trends less certain than the temperature trends (narrower shaded bands).
Temperature
Today, average temperatures in the GYA slowly rise each year from the end of December to late July by over 40.0°F (22.2°C), and then decline again beginning in August (Figure 3-4, top row). Variability in monthly temperatures from year to year is greatest in winter and smallest in summer. Although monthly average temperatures have changed since 1950, those changes (Figure 3-4, from beginning to end of monthly lines) have been small compared to month-to-month and season-to-season differences (Figure 3-4). Temperature increases within the months have not yet equaled the historical differences between months. More simply: even with warming temperatures the coolest days in November are, on average, cooler than the coolest days in October, both in 1950 and today.
Temperatures in some months, however, have become like one might have historically expected for an adjacent month. For example, March temperatures have increased since 1950 and are now more similar to April than to February. Consequently, the duration of winter cold has been reduced. Spring warming is earlier in the year now than it was in the mid-20th century, and the month-to-month warming of >10°F (>6°C) that previously occurred from March to April now occurs from February to March. The change is large relative to the variability typically experienced from year to year. In other months, the range in temperature from one year to the next remains larger than the change since 1950. October displays the least temperature change of any month.
Precipitation
On average, between 1.0-2.0 inches (2.5-5.1 cm) of precipitation is received during most months of the year (middle row, Figure 3-4). The maximum amount of precipitation typically falls in May, June, and September and can reach as high as 4.5 inches (17 cm), but this amount varies substantially from one year to the next. During droughts, average monthly precipitation decreases to less than 0.5 inches (1 cm). Wet extremes of more than 2.5 inches (6.4 cm)/month and unusually dry conditions of 0.5 inches (1 cm)/month or less have also been common from September to January.

Lake of the Woods, near the triple junction of the Green-Colorado, Wind-Missouri, and Snake-Columbia river watersheds, Union Pass, Wyoming. Photo courtesy of Bryan Shuman.
Since 1950, the biggest change in precipitation has occurred in April and May. April now is as wet as May was in the mid-20th century and May precipitation has increased to a new average monthly high of 2.5 inches (6.4 cm)/month (Figure 3-4). A substantial decline in June, combined with the April–May increases, indicates that most precipitation now falls earlier in the year than in the mid-to-late 20th century. Year-to-year and decade-to-decade variability dominates the trends in many months, and notable increases in precipitation from September to November have occurred since the 1950s. A prominent decline in January precipitation since the 1950s means that wet years no longer reach more than 1.8 inches (4.5 cm)/month , even though they exceeded 2.0 inches (5.1 cm)/month six times before 1980.
April now is as wet as May was in the mid-20th century and May precipitation has increased to a new average monthly high of 2.5 inches (6.4 cm)/month (Figure 3-4). A substantial decline in June, combined with the April–May increases, indicates that the most precipitation now falls earlier in the year than in the mid-to-late 20th century.
Snowfall
Snowfall tracks the seasonal cycle of temperature and peaks from December through February, with monthly totals often exceeding 20.0 inches (50.8 cm) when averaged across the GYA (Figure 3.4, bottom row). Measurable snowfall historically has been limited in June and September and is extremely rare in July and August. Interannual variability is typically greatest in December with monthly totals ranging from less than 5.0 inches (13 cm) to more than 30.0 inches (76.2 cm). January snowfall totals have been consistently the highest with only one year since 1950 below 5.0 inches (13 cm).
January snowfall has declined by an average of 7.5 inches (19 cm; 43% of the average monthly total from 1950-2018) since the 1950s (line in Figure 3.4), and extreme snowfalls today reach a maximum of 25.0 inches (63.5 cm) even though they had exceeded 30.0 inches (76.2 cm; dots in Figure 3.4) before the 1980s. March snowfall has also substantially declined by about 7.0 inches (18 cm; 53%) compared to amounts before 1980. Overall, the snow-free season has lengthened with snow accumulation in June and September declining to near zero.
Recent climate changes in the GYA are hard to explain without accounting for the effects of increasing greenhouse gases (GHGs) in the atmosphere. For example, one study of Wyoming temperature trends from 1910 through 2000 examined the influence of natural drivers of climate change including variations in oceanic-atmospheric circulation patterns (El Niño-Southern Oscillation [ENSO], Pacific Decadal Oscillation [PDO], and Atlantic Multi-decadal Oscillation [AMO]), volcanic eruptions, and the influence of anthropogenic climate drivers, namely the emission of GHGs (Shuman 2012). The study showed that the warming trend since 1980 could only be explained by including the influence of increasing emissions of GHGs (black line). Variations in oceanic and atmospheric circulation patterns were particularly relevant for explaining past decadal fluctuations in temperature (dotted line in figure). The eruptions of El Chicon, Mexico, in 1982, and Mount Pinatubo, Philippines, in 1991 released hemispheric-spanning ash clouds that led to cold years (dashed line in figure). Solar variability was also examined in the study and shown to have no predictive power for the regional temperature history.
Just as a dice rolled many times rarely produces a consistent string of high numbers, it is unlikely that the recent string of warm years in Wyoming is caused by chance alone (Shuman 2012). Drivers of year-to-year variability in temperature are complex, but the warming trend since 1980 has a strong fingerprint of human activity, namely the increases in GHGs.

Wyoming average temperatures from 1895-2019 (orange line) were compared with trends expected from important natural climate drivers including ENSO, PDO, AMO, and volcanic eruptions (blue line). The combination of influences that best predicted the observed changes (black line) also includes added anthropogenic effects, specifically atmospheric greenhouse gas concentrations, which accounts for an added 1.2°F (0.67°C) of warming since 1970 compared to the natural influences alone. The dotted line shows the statewide average temperature for 1895-2019. Updated based on Shuman (2012).
Climate trends by month, elevation, and watershed
To summarize the long-term trends in the average annual and monthly records at different locations, we calculated the average trend (using linear regression) over all the weather-station records. Checkerboard plots with squares for each month and location are colored to show the direction and magnitude of change represented by the average trend in a) temperature (Figures 3-5 and 3-6), b) precipitation (Figures 3-7 and 3-8), and c) snowfall (Figures 3-9 and 3-10). The checkerboard plots for each climate variable show:
-
the trends for the entire GYA in the top row and trends for either HUC watersheds or elevation bands in the rows below;
-
the direction of change—warming or cooling (orange or blue), moistening or drying (green or brown)—and the magnitude of the trend (as color intensity) from 1950-2018 plotted by month (the last column represents the average monthly change); and
-
gray slashes to indicate locations or months where the trends are too small to be statistically significant.
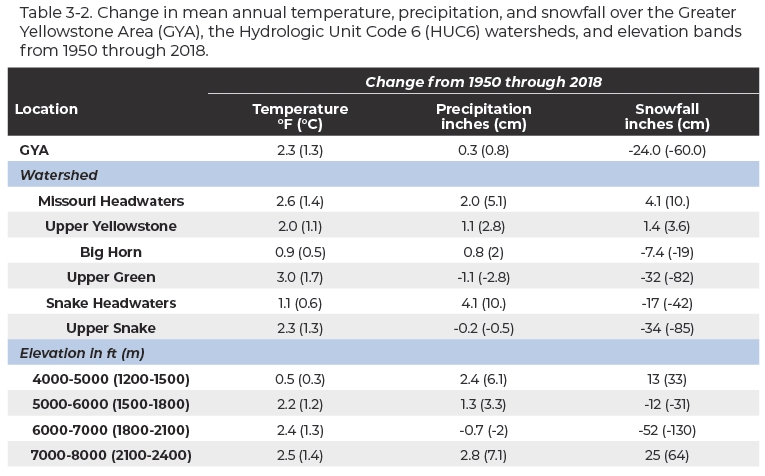
For precipitation and snowfall only, related bar graphs summarize the magnitudes of the changes (bar graphs in Figures 3-7 and 3-9), including as a percent of the long-term mean (bar graphs in Figures 3-8 and 3-10). Linear trends are summarized in Table 3-2.

Figure 3-5. Temperature trends from 1950-2018 by elevation and month in the GYA. We have less confidence in the boxes with slashes because the trend is small (that is, the slope of the regression in degrees/decade was not statistically significant at the 95% confidence level). The last column (Avg) is the rate of change in the mean annual temperature of each elevation band.

Figure 3-6. Temperature trends from 1950-2018 by watershed and month in the Greater Yellowstone Area (GYA). We have less confidence in the boxes with slashes because the trend is small (that is, the slope of the regression in degrees/decade is not statistically significant at the 95% confidence level). The last column (Avg) is the rate of change in the mean annual temperature of each watershed.

Figure 3-7. Precipitation trends from 1950-2018 by elevation and month in the Greater Yellowstone Area (GYA). We have less confidence in the boxes with slashes because the trend is small (that is, the slope of the regression in inches/decade is not statistically significant at the 95% confidence level). The last column (Avg) is the mean rate of change in precipitation across all months for each elevation.

Figure 3-8. Precipitation trends from 1950-2018 by watershed and month. We have less confidence in the boxes with slashes because the trend is small (that is, the slope of the regression in inches/decade is not statistically significant at the 95% confidence level). The last column (Avg) is the mean rate of change in precipitation across all months in each watershed.

Figure 3-9. Snowfall trends from 1950-2018 by elevation and month. We have less confidence in the boxes with slashes because the trend is small (that is, the slope of the regression in inches/decade is not statistically significant at the 95% confidence level). The last column (Avg) is the mean rate of change in snowfall across all months for each elevation.

Figure 3-10. Snowfall trends from 1950-2018 by watershed and month. We have less confidence in the boxes with slashes because the trend is small (that is, the slope of the regression in inches/decade is not statistically significant at the 95% confidence level). The last column (Avg) is the mean rate of change in snowfall across all months in each watershed.
Temperature
The analyses of historical temperatures across the GYA, summarized in Figures 3-5 and 3-6, and Table 3-2, provide insight, as shown below, into how GYA temperatures have changed since 1950.
Annual temperature changes since 1950
-
The mean annual temperature in the GYA has warmed by 2.3°F (1.3°C).
-
Annual temperature in the GYA has risen significantly when averaged across all elevations and watersheds (last column in Figures 3-5 and 3-6).
-
Mean annual temperatures have warmed the least in areas below 5000 ft (1500 m) elevation (last column in Figures 3-5 and 3-6).
Magnitude of warming and temperature trends since 1950
-
The magnitude of warming since 1950 varies by month and watershed (indicated by the color scale in °F/decade in Figures 3-5 and 3-6).
-
Temperature trends among the HUC6 watersheds and elevation bands have been least consistent in fall and winter (Figure 3-6). October, December, and February
-
cooled or showed no temperature change when averaged across elevations (Figure 3-5) and within the eastern watersheds (Upper Yellowstone, Big Horn, and Upper Green, Figure 3-6).
-
Except for October and December, all months have warmed across the GYA (orange and red boxes, top row, Figures 3-5 and 3-6).
-
The annual trends are not significant below 5000 ft (1500 m) elevation nor in the Upper Yellowstone and Big Horn watersheds (gray slashes in last column in Figures 3-5 and 3-6), but all watersheds and elevation bands warmed significantly in March. Changes for the entire GYA are consistent with the data shown in Figures 3-2, 3-3, and 3-4.
Total precipitation
Figures 3-7 and 3-8 show the trends in precipitation from 1950-2018 (color scale in inches/decade), and the bar graphs show the magnitude of change in inches (Figure 3-7) and percent change (Figure 3-8) calculated from the trends. Those figures, along with Table 3-2, provide insight into the magnitude of GYA precipitation and precipitation trends since 1950. Average annual precipitation in the GYA today remains about the same as that of 1950, but the seasonal patterns that control the region’s water resources have changed considerably.
-
Spring and fall.—The trends show that both spring and fall precipitation, which can be rain or snow depending on the temperature, have increased while summer precipitation, usually rain, has decreased. Spring and fall now contribute a larger proportion of the region’s total amount of precipitation compared to the 1950s. Late spring (April and May) precipitation has increased by an average of 20% and fall (September through November) precipitation has increased by 24% (Figure 3-8).
-
Winter.—Total precipitation has declined from December through March, predominantly between 6000-7000 ft (1800-2100 m) elevation (Figures 3-2 and 3-7). January precipitation has declined to 40% below the long-term average (Figure 3-8) and represents most of the winter drying. The year-to-year variability in winter precipitation remains high compared to the long-term trend in most of the watersheds, but the Upper Snake has consistently dried in all winter months.
-
Summer.—Precipitation in June through August has also declined by as much as 17% across all watersheds and elevations, except for the Snake Headwaters watershed. The long-term changes have been small compared to the year-to-year variability (Figure 3-4), but even modest shifts in summer conditions can have widespread effects on the landscape by drying vegetation and ground fuels that promote wildfires. An unusually dry summer contributed to the major wildfires in Yellowstone National Park during 1988 and demonstrates how weather can interact with fire (see box on the 1988 Yellowstone fires). If the average amount of summer precipitation continues to decline, a drier climate could contribute to more frequent and severe wildfires.
[Since 1950] annual temperature in the GYA has risen significantly when averaged across all elevations and watersheds. … Average annual precipitation in the GYA today remains about the same as that of 1950, but the seasonal patterns that control the region’s water resources have changed considerably.… [For example,] spring and fall now contribute a larger proportion of the region’s total amount of precipitation compared to the 1950s.
Snowfall
High-elevation snowpack is the main source of runoff and freshwater in the GYA, as it is throughout mountainous areas of the western US. Snow accumulates at high elevations during fall, winter, and spring (Figure 3-4). Spring warming initiates annual snowmelt that recharges groundwater, sustains rivers, and supports ecosystems and communities. During years with low snowpack, less snowmelt is produced, and summer water supplies can become scarce across large (regional) areas. High spring temperatures that melt snow earlier than average can also reduce summer waters, even during years with high snowpack. At finer geographic scales, complex interactions between local geology, soils, slope and aspect, and vegetation must also be considered, but each year’s availability of water is most affected by snowpack and temperature.
Climate trends that alter snow accumulation and the snowmelt period, as well as year-to-year variability, affect water availability in rivers, lakes, reservoirs, and wetlands (McMenamin et al. 2008; Schook and Cooper 2014; Ray et al. 2019), groundwater recharge (Rye and Truesdall 2007; Gardner et al. 2010), and accessibility for uptake by plants and animals (Middleton et al. 2013; Notaro et al. 2019; Potter, 2020).
Annual snowfall
Like most of the western United States, average annual snowfall in the GYA has declined dramatically since the mid-20th century (Mote et al. 2018). Total snowfall averaged across the GYA declined by 3.5 inches (8.9 cm)/decade since 1950. That reduction means nearly 24.0 inches (60.0 cm) less snow now falls on average each year (bar graph in Figure 3-9), about a 25% reduction from the long-term average (Figure 3-10). Much of the snowpack decline in the West is attributed to pronounced spring warming (Pederson et al. 2011b; Milly and Dunne 2020), and it is a key feature of warming trends in the GYA (Figures 3-4, 3-5, and 3-6).
The Missouri Headwaters and Upper Yellowstone are the only HUC6 watersheds not to have experienced a decline in average annual snowfall since the 1950s (last column, Figure 3-10), although snowfall has decreased in those watersheds in January and March.
Total snowfall averaged across the GYA declined by 3.5 inches (8.9 cm)/decade since 1950. That reduction means nearly 24.0 inches (60.0 cm) less snow now falls on average each year (bar graph in Figure 3-9), about a 25% reduction from the long-term average (Figure 3-10). Much of the snowpack decline in the West is attributed to pronounced spring warming (Pederson et al. 2011b; Milly and Dunne 2020), and it is a key feature of warming trends in the GYA (Figures 3-4, 3-5, and 3-6).

Aerial view of crown fire with billowing smoke on the Mirror Plateau of Yellowstone National Park, 1988. Photo courtesy of Jim Peaco.
From 1980-2016, fires of more than 10 acres (4 ha) in size burned 6,507,003 acres (2,633,291 ha) in and around the GYA (Figure A). Inside the Greater Yellowstone Area (GYA) boundary, 598 fires of 10 acres (4 ha) or more burned a total of 4,550,561 acres (1,841,547 ha). The year 1988 stands out as an extreme fire year, both in terms of the acres burned and the number of fires (Figure B)


Figures: A) Location of wildfires of 10 acres (4 ha) or more in size from 1980 through 2016. These fires were started by lightning and humans. The triangles are scaled to the size of the fires as indicated. B) Annual area burned (top) and number of fires (bottom) that are greater than 10 acres (4 ha) in size within the GYA from 1980 through 2016. Data from the USGS Federal Wildland Fire Occurrence Data (USGS undated).
The conditions that set the stage for the 1988 Yellowstone fires began the previous winter when snowpack was only 30% of average, giving 1988 a dry and early start to the fire season. Late spring and early summer followed with no measurable rain, resulting in a record-setting drought by mid-summer (see Chapter 2).
Dry vegetation and ground fuels, coupled with high winds, created walls of flame hundreds of feet high and plumes of smoke that shocked the public watching on television and seasoned fire fighters alike. Over $120 million was spent and more than 25,000 people fought the fires, mostly to ensure human safety and preserve structures. Efforts to control fires proved pointless. An inch of snow in late September finally ended the fire season, after 36% of the park (793,800 acres [321,200 ha]) had burned (Figure C). The scale of the fires and the newly blackened landscape that emerged resulted in a media frenzy claiming the “death of Yellowstone.”

Figure C. Fires in and near Yellowstone 1988 (NPS undated).
Before 1988, ecologists and park managers knew that periodic fire maintains the mixture of forest and meadow habitats needed by Yellowstone wildlife. Although the post-1988 landscape looked very different to park visitors, the ecological effects were not as devastating as reported in the news. The impacts to rivers and lakes were minimal and short lived. Native vegetation regenerated quickly in burned areas, and wildlife took advantage of new habitats in the years after the fire. Scientific studies following the 1988 fire confirm that Yellowstone’s ecosystems have evolved with large severe fires, which occur every few centuries.
The close relationship between large fires and warming raises concern for the future. Although the fires of 1988 were unusual at the time, events of that scale have occurred many times across the western United States since, and the fire season is now several weeks longer than it was in 1988. More large fires are expected in the decades ahead as temperatures rise, snowpack is reduced, and summers become drier. If fires like the 1988 event occur more frequently in the future, we may see significant ecological change as well as increasing threats to human health and communities.
The rate of snowfall decline has been greatest in January and March, dropping by more than 1.0 inch (2.5 cm)/decade and by 2.2 inches (5.6 cm)/decade at elevations from 6000-7000 ft (1800-2100 m) (Figure 3-9). Decreasing snowfall best explains the decline in total precipitation from 6000-7000 ft (1800-2100 m; Figure 3-8). As a result of the reduced accumulation in this critical elevation range, January and March snowfall have declined since 1950 across the GYA by 53 and 43%, respectively. The mid-to-late winter changes in snowfall are only surpassed by the near elimination (96% reduction) of the much smaller total amount in September (Figure 3-10). In contrast to the overall reduction, mean annual snowfall has increased slightly in areas below 5000 ft (1500 m) and above 7000 ft (2100 m) elevation (Figure 3-9), but the trends there are less significant compared to the drying trends at the other elevations because year-to-year variations at high and low elevations have been large compared to the long-term trends.
The average amount of snowfall is typically lower in spring than winter, though spring snow still contributes critical snowpack to the GYA (Figure 3-4). Spring snowfall and retention are sensitive to temperature change because average spring temperatures are close to the freezing point. Temperatures have risen fastest in spring, particularly in March (Figures 3-5 and 3-6), and this warming has contributed to the decline in March snowfall (Figures 3-9 and 3-10). The rate of decline has been highest between 6000-7000 ft (1800-2100 m) and in the Snake Headwaters watershed, but all watersheds show a downward trend in March snowfall.
Snow water equivalent, another measure of water availability
The trends show that less snow falls in the GYA today compared to the mid-20th century, but the total amount of water contained in the snowmelt, known as the snow water equivalent (SWE), is a better measure of available water. Snow water equivalent typically peaks in spring each year (Pederson et al. 2011a) and is usually reported on April 1 to enable year-to-year comparison (see Chapter 2). It is difficult to infer snow water equivalent from snowfall or snow depth (Sturm et al. 2010) because snow density varies with the temperature at which snow forms in the atmosphere and how it settles on the ground and compacts. Nonetheless, April 1 SWE estimates are good for assessing annual water supply and the potential for drought in snowmelt-dominant regions (Pagano et al. 2004).
Climate changes since the early 20th century show that snow water equivalent losses throughout the western United States have gradually reduced the amount of water delivered to major river basins in response to both drying and warming (Udall and Overpeck 2017; Hoerling et al. 2019). Previous work in the GYA shows that April 1 SWE—representing the volume of snowmelt that can enter rivers and be available during dry summer months—declined from 1961-2012 at 70% of sites located across a range of elevations in each of the six watersheds (Tercek et al. 2015). Sites with declining snowpack generally experienced warming during winter months over the same period (Tercek et al. 2015). In the 1990s to 2000s, spring snow water equivalent in GYA was at least 20% below the long-term average of the last eight centuries (see Chapter 2; Pederson et al. 2011b), indicating that the current downturn is substantial in the context of long-term climate trends. If snow water equivalent losses continue, droughts will likely become more frequent and severe. Drought could also become less predictable since a larger portion of the annual water supply will come from irregular rainfall and a reduced amount of snowmelt compared to historical averages (Livneh and Badger 2020).
The Wind River Range in the southern GYA contains the greatest density of glaciers in the US Rocky Mountains. The contribution of glacial meltwater buffers adjacent lakes and streams from seasonal drawdown. Climate changes in the region, however, have the potential to profoundly transform the glaciers and alter the critical water supplies they provide.
With reduced snowfall and increasing temperatures, the extent of the Wind River Range glaciers has begun to change. Glacial ice depth and perimeter measurements from Wyoming’s Dinwoody Glacier (located in the Wind River Range of the Fitzpatrick Wilderness) over the past several decades reveal a significant decline in depth and extent of this glacier (Cheesbrough 2007). In his 2007 thesis, Cheesbrough compared photos from 1935, 1950, and 2006 (Figure A). An additional photo from 2015 provides more recent imagery for comparison. Qualitative evidence from the repeat photography demonstrates visual changes in the Dinwoody Glacier. Quantitative observations obtained using elevations derived from a global positioning system and mapping of the ice-margin further demonstrate a decrease in ice depth and progressive retreat of the ice. Ongoing work is expanding such measurements to complement the qualitative assessment of change from photography. Year-to-year changes in temperature and snowfall, such as a heavy snow year in 2017, create variability in the extent of open ice on the glacier surface, but mapping the margin reveals reduction during the past decade (Figure B). The changes are consistent with declining spring snowfall (Figure 3-10) and rising temperatures in the Big Horn watershed (Figure 3-6).

Figure A. From Cheesbrough (2007): “ Repeat ground photographs showing Dinwoody Glacier in A) 1935, B) 1988, and C) 2006. 1935 photos were obtained from the American Heritage Center in Laramie, Wyoming; 1988 photos were obtained from Marston et al. (1991). The fourth image D) in the series is from 2015 and was taken by Darran Wells on the CWC Alpine Science Institute’s Interdisciplinary Climate Change Expedition.

Figure B. Map of perimeter of Dinwoody Glacier over years looking north. Data collected for years when there was no snow cover on the ice in August are more representative of the actual terminus. Accuracy of approximately 1.0 m (3.2 ft). Map created by Jacki Klancher.
Historical Hydrological Changes in the GYA
We focus on how climate changes have affected streamflow and groundwater extending back to 1925.
Average streamflow trends
Rivers in the GYA function:
-
as habitat for aquatic and riparian species (Minshall and Brock 1991; Van Kirk et al. 2001);
-
to redistribute water from headwater areas to lower elevations and from the subsurface to surface through groundwater-streambed connections (Tercek et al. 2015);
-
to provide diversions for communities and agriculture (Nolan and Miller 1995; Zelt et al. 1999; Hansen and Rotella 2002; Gosnell et al. 2006); and
-
to carry runoff to the Missouri-Mississippi, Colorado, and Columbia river systems.
Both surface runoff and groundwater make up streamflow (measured in cubic feet/second or cubic meters/second). The average annual streamflow from a watershed varies with the amount of water gained through runoff, gained from and lost to seepage through the streambed, and lost from evapotranspiration and diversions.
Natural and human impacts
Annual streamflow varies widely among GYA rivers, as exemplified by the low flows in the Ruby River[1] compared to the high flows in the Yellowstone River. Streamflow also varies along the length of a river as tributaries combine, such as in the Snake River in Wyoming where streamflow near Alpine (downstream) exceeds streamflow near Moran (Figure 3-11a).
Historical flows across the GYA
Historical trends in mean annual streamflow reflect gradual shifts in the amount of water delivered to rivers by precipitation and runoff and by changes in human water use (Meyer 2001). Human-induced changes in streamflow have arisen from alteration of erosion and sedimentation (e.g., riprapping banks), water diversion from river channels (e.g., for irrigation), and water impoundment behind dams. The presence and operation of the Jackson Lake Dam, for example, has decreased spring flooding and increased late-summer streamflow downstream in the Snake River compared to natural flows (Schmidt and White 2003).
To assess the effects of climate change on streamflow, we examine data from 12 streamgages that measure modified streamflow and from five streamgages that measure essentially unmodified streamflow (Yellowstone at the Yellowstone Lake’s outlet and at Corwin Springs, Gardner at Mammoth, South Fork at Shoshone, and Madison at West Yellowstone). All streams have continuous flow records since 1925 (Figures 3-11, 3-12, and 3-13). The unmodified streams allow us to assess effects attributable to climate alone.

Figure 3-11. A) Mean annual streamflow at streamgages on the indicated rivers (varying lines) and trend lines fitted by linear regression (straight lines). The gray shading indicates the statistical uncertainty of the regression at a 95% confidence level. B) Mean annual streamflow at streamgages in the Greater Yellowstone Area (GYA) shown as the percent change relative to the 1925-2018 mean indicated by the dashed line. Each dot in the plots represents the percent change. Values above the dashed line indicate higher-than-average streamflow, and values below the line indicate lower-than-average streamflow. The black line is the LOESS regression fit to the point data and the gray shading indicates the 95% confidence level around the trend LOESS lines. The LOESS fits are used to highlight trends in the data. C) Palmer Drought Severity Index (PDSI). PDSI measures the intensity of long-term drought or wet periods by including both the current and cumulative effects of temperature and precipitation over months. Positive values indicate wet periods, and negative values indicate dry periods; values below -3 indicate severe to extreme drought. The orange vertical box indicates the period of the 1930s Dust Bowl drought. See Figure 2-5 for classification of the index.
Streamflow may not change linearly with precipitation due to factors that vary among watersheds and influence runoff to streams, like evapotranspiration (Emanuel et al. 2010), soil properties (McNamara et al. 2005), underlying geology (Frisbee et al. 2011), groundwater storage (Leppi et al. 2012), and the length of the drainage network through which water is transported from its source to a particular point in the river (e.g., surface flow from a snowfield down a hillside to a tributary stream). Mean annual streamflow (varying lines) and the linear trends (straight lines) from each of the selected streamgages show the range of hydrologic changes since 1925 (Figure 3-11A). The mean of annual streamflow across all gages indicates a trend toward overall increased streamflow in the GYA (dots in Figure 3-11B represent individual years; curved line shows the long-term trends over decades); the increase is most apparent on the Gallatin, Yellowstone, Madison, and Lamar rivers (Figure 3-11A). Because other rivers, such as the Green and Wind, declined or remain the same over time, the GYA mean represents a less than 10% percent increase relative to the mean streamflow from 1925-2018 (Figure 3-11B).
Previous work shows that streamflow in the region has declined in recent decades (Leppi et al. 2012), but our analysis indicates that streamflow has increased since 1925 in some rivers. The long-term rise in streamflow we find reflects the recovery of flows after the 1930s Dust Bowl drought. However, additional changes have taken place since the 1950s when most of the temperature change has occurred. For example, as indicated in the annual streamflow data in the graphs, the Madison, Gallatin, and Yellowstone rivers have experienced decreased streamflow since 1950, even though their overall discharge has increased since the Dust Bowl drought.
During and after the 1930s Dust Bowl (orange shading in Figure 3-11B), mean annual streamflow (dots) from 1929-1941 was 5-40% less than the mean from 1925-2018 (horizontal dashed line), indicating a period of extreme drought. The timing of the diminished annual streamflow aligns with the lowest Palmer Drought Severity Index values over the 94 yr of record (PDSI; orange shading in Figure 3-11C). Streamgage records and PDSI also indicate severe drought in the late 1980s and again in the early 2000s when mean annual streamflow dropped by as much as 30% relative to the 1925-2018 mean. The duration of reduced streamflow during the early 2000s drought was shorter than that of the 1930s Dust Bowl drought and the major droughts of previous centuries, but it was likely more severe (Cook et al. 2010; Martin et al. 2020). Many years since 1925 exhibit unusually high mean annual streamflow, including eight years (1928, 1971, 1974, 1996, 1997, 2011, 2017, 2018) when streamflow was 30-60% higher than the 1925-2018 mean and the positive PDSI values indicate wetter-than-normal conditions. The three years of highest annual streamflow (1997, 2011, 2017) occurred since 1997 (Figure 3-11B). Overall, however, the long-term trends of most individual streamgage records (Figure 3-11A) show little long-term change in annual streamflow since 1925.
Peak streamflow trends
The distribution of streamflow throughout the year can change even if annual average flows remain unchanged. Changes in the distribution can contribute to spring flooding and late-summer drought.
Streamflow in the GYA typically peaks in late spring and early summer as snowmelt saturates the ground and floods the rivers. The date of peak streamflow varies from year to year in conjunction with variations in precipitation, temperature, and snowpack. Figure 3-12A shows the change in the date of peak streamflow as the difference (in number of days) of the date of peak streamflow relative to the average date for the period from 1925-2018. Higher values indicate that peak streamflow occurred later in the year and lower values indicate that it occurred earlier. Figure 3-12B shows that the annual date of peak streamflow averaged across all rivers and gages has shifted earlier in the year since the 1950s.[2]
[T]he annual date of peak streamflow averaged across all rivers and gages has shifted earlier in the year since the 1950s.

Figure 3-12. The average date of peak annual streamflow, as the difference (in number of days) relative to the 1925-2018 average (A) and as the calendar date (B). In A) the vertical lines indicate the number of days earlier (negative values) or later (positive values) that peak flow occurred relative to the 1925-2018 mean date (June 9) indicated by the solid line at zero. In B) the black line is the LOESS regression fit to the point data and the gray shading indicates the 95% confidence level around the trend LOESS lines. The LOESS fits are used to highlight trends in the data. C) Shows the calendar date of peak annual streamflow of individual streamgages (variable lines) and the trend fitted by linear regression. The gray shading around the regression lines indicates the statistical uncertainty of the trend at a 95% confidence level.
Most of the 15 individual records show a trend toward earlier peak streamflow dates, regardless of the degree of human management. Figure 3-12C shows each record with the linear trend since 1925. The Ruby, Yellowstone (near Livingston), and Snake rivers experienced the largest changes, and peak flow now occurs later in the year only on the Teton River (Figure 3-12C). The average date of peak streamflow in the 15 rivers (Figure 3-12B) ranges from late May to mid-July depending on when temperatures were sufficiently high to melt snow; site-specific climate and water management variations, however, cause the date of peak flow in individual rivers to range any time from March to October (Figure 3-12C).
Year-to-year variability in the timing of peak streamflow is high and many years experienced later-than-average peak flow (positive values in Figure 3-12A). Peak streamflow at least 15 days later than the 1925-2018 average has been recorded in four years since 1940. Snowpack conditions and temperature likely contributed to the late timing during some years, such as in 1975 when streamflow peaked 20 days later than average: temperatures from April–May were the coolest on record, and snowfall was higher than 92% of the years since 1925.
Unusually warm conditions during the Dust Bowl drought caused streamflow in the GYA to peak up to 17 days earlier in the 1930s than the 1925-2018 average in mid-June (Figure 3-12A and B). Peak streamflow then recovered to near the average date by the 1950s. Streamflow now peaks 8 days earlier than during the mid-20th century, which is comparable to the changes during the Dust Bowl years (Figure 3-12B). In the absence of prolonged drought today (Figure 3-11C), rising spring temperatures (Figures 3-4, 3-5, and 3-6) that cause snow to melt earlier are likely the source of the recent trend in the GYA, as is the case elsewhere in the western United States (McCabe and Clark 2005; Stewart et al. 2005; Dudley et al. 2017).
Over each decade since the 1970s, average timing of peak streamflow has occurred earlier than in previous decades. The proportion of years with earlier-than-average peak streamflow increased after 1970 (Figure 3-12A) as indicated by the steep trend line (Figure 3-12B). Fifteen of the years between 1998 and 2018 and all years since 2008 have experienced earlier-than-average peak streamflow.
Over each decade since the 1970s average timing of peak streamflow has occurred earlier than in previous decades.
Free-flowing rivers are considered reliable indicators of climate change given little-to-no human alteration of flow regimes. Figure 3-13 (left column) shows average monthly streamflow for five free-flowing rivers in the GYA. We compare streamflow averages for those rivers from a recent period (1985-2018) to an earlier period (1950-1984). While peak flows during both periods occur in June, spring flows in the 1985-2018 period increased by 30-80% relative to the 1950-1984 period, and summer and fall minimum flows declined by 10-40% (right-hand column, Figure 3-13).

Figure 3-13. Monthly mean streamflow in free-flowing rivers in the Greater Yellowstone Area (GYA) from 1985-2018 (left column), and percent changes from the 1950-1984 average (right column; the averaging period for the South Fork Shoshone River is 1960-1989). The asterisks indicate changes that are statistically significant at the 90% confidence level (based on a means t-test). The inset numbers are the percent change in total annual flow between the periods. The rivers are selected based on USGS streamgages identified in the USGS Hydro-Climate Data Network as having little or no human influence on natural flows (Lins 2012).
Influences of climate change on groundwater
Groundwater, or water that fills pores or fractures in underground materials such as sand, gravel, and rock, is of vital importance to the GYA. Groundwater supplies clean drinking water for communities, provides irrigation water, and is essential to Yellowstone’s iconic geysers. The availability and quality of groundwater in the GYA depends on location. Factors that control the amount of groundwater and the outflow from springs include elevation and topography, the nature of the underlying rocks and sediments (the aquifer), and the rates of refilling (recharge) of aquifers (Figure 3-14).

Figure 3-14. Schematic of the relationships among surface water, groundwater, and land use. (Illustration credit: prepared by Veronica Orosz with funding from USDA grant 2008-51130-19555.)
Snowmelt provides a majority of the water for aquifer recharge in the mountain systems of the GYA (e.g., Gardner et al. 2010; Tercek et al. 2015), whereas seepage from stream channels and surface-water irrigation systems are important sources of recharge in valley areas (see box) (Johnson et al. 1999; Kendy and Bredehoeft 2006; Peterson 2010). Groundwater-fed springs maintain streamflow and wetlands in late summer and fall, long after the winter snowpack has melted. However, the time it takes for surface water to percolate through the groundwater system and emerge as inflow ranges from a few months in valleys filled with porous sands and gravels to decades, centuries, and longer in deep aquifers. More rapid snowmelt can reduce the amount of time that seepage from stream channels can recharge water to aquifers, thereby reducing aquifer recharge from natural sources and modifying the length of time water resides underground.
To the southwest of Yellowstone National Park, the Eastern Snake Plain Aquifer (ESPA) supports cities, global-scale agriculture, and the Nation’s largest fish-farming industry. Over the past 14 million years, the passage of the North American Plate over a hotspot produced a track of northeast-southwest trending volcanic centers from the Idaho-Oregon border to Yellowstone (Pierce et al. 1992). This same hotpot has been under the GYA for the past 2 million years and provides the energy for spectacular volcanic and geothermal features in what is now Yellowstone National Park. The landscape was covered by thousands of feet of ice during glacial times (see Chapter 2), and glaciers and streams deposited thick packets of sands and gravels on top of fractured volcanic rock. This distinctive geologic setting provides a reservoir for groundwater in a roughly 10,000 mile2 (25,000 km2) aquifer that is unique on Earth because of its geology and the strong interactions between groundwater and surface water. Water from the ESPA flows back into the Snake River at numerous locations along its course, maintaining streamflow for fish and wildlife, as well as irrigation and other uses downstream.
Although only a few percent of the Eastern Snake Plain Aquifer lies within the GYA, about 20% of the annual recharge to the aquifer is provided by rivers that originate in the GYA. Seepage from irrigation canals and traditional flood irrigation practices provide most of the remainder. During the 1970s through 1990s, most farmers on the ESPA switched from flood irrigation to sprinklers. Although sprinklers are more efficient, this change greatly reduced the amount of water that recharges the ESPA on agricultural lands (Boggs et al. 2010). Climate change will increase demand for water during warmer and drier summers. In addition, decreased snowpack and earlier spring runoff will reduce summer streamflow and prompt irrigators to increase reliance on groundwater or become even more efficient with their surface water. Both actions decrease aquifer levels, which in turn will decrease the amount of water that flows out of the aquifer and back into the Snake River. This tight coupling of surface and subsurface water, along with the high degree of human management, act to magnify the effect of climate change for this system (Hoekema and Sridhar 2013).
Increased irrigation efficiency and its negative effects on recharge have also been widely documented in the GYA’s river valleys (Venn et al. 2004; Kendy and Bredehoeft 2006; Lonsdale et al. 2020). Thus, these aquifers are susceptible to the effects of climate change through loss of natural recharge, as well as through the same feedback mechanism observed on the Eastern Snake Plain Aquifer. Careful irrigation practices provide an opportunity to recharge groundwater to buffer climate-driven impacts in the future. A water management strategy called managed aquifer recharge (intentional introduction of water into aquifers through injection wells or seepage ponds) allows aquifers to serve as large natural reservoirs, increasing the resilience of both surface water and groundwater supplies to climate change (Lonsdale et al. 2020). Important fish and wildlife habitat in GYA’s valley areas can be maintained and enhanced in a warming climate with carefully planned managed aquifer recharge (Kendy and Bredehoeft 2006; Van Kirk et al. 2020).
In summary, groundwater sources, rates of recharge, and flow are difficult to understand in areas of complex topography. Hence, the contribution of groundwater in mountainous and rugged areas of the GYA is poorly understood. On the other hand, appropriate water management actions on the Eastern Snake Plain Aquifer and in GYA’s river valleys can help buffer the effects of climate change. Threats to groundwater from climate change will be variable across the GYA and are not well known or easily measured for many regions. Addressing this unknown, then, is an area of important future research.
Within Yellowstone National Park and adjacent regions underlain by volcanic rock, the abundant springs are groundwater emerging at the surface. The springs forming the headwaters of the Madison River and Henrys Fork, on the Yellowstone Plateau, are good examples. Because their recharge areas are at high elevation—areas of high precipitation and deep snow—and because large volumes of water are stored below ground in some areas, springs may be more resilient to future climate changes than surface water (Burnett 2020).
The history of Old Faithful reveals, however, that not all groundwater is resilient to climate change. The geyser erupts less frequently during years of low precipitation and snowpack, demonstrating the tight coupling of surface water and groundwater in that area, and evidence that groundwater can respond quickly to changes in snowpack, including those anticipated as the climate changes (see box in Chapter 2 regarding drought impact on Old Faithful). Old Faithful is not the rule. Generally, many decades are required for water to move through some of the deep Yellowstone Plateau aquifers. Thus, changes in groundwater due to climate change are usually difficult to assess and may not be evident for many decades (Benjamin 2000; Gardner et al. 2010).
The groundwater supplies that are likely to be most vulnerable to climate change are those found in most of the GYA’s low- to mid-elevation river valleys, such as those of the Teton, Madison, and Gallatin rivers. These aquifers store relatively small amounts of water and are recharged by a combination of snowmelt-fed streams and irrigation seepage. Because these aquifers are relatively small, they potentially will change rapidly as the climate changes. Moreover, many of these river valleys are experiencing rapid population growth, which reduces the amount of irrigation seepage and increases the amount of groundwater withdrawn for drinking water and household use (Baker et al. 2014).

Grand Prismatic Spring, Yellowstone National Park. Photo courtesy of Cathy Whitlock.
Summary
Figure 3-15 provides a graphical compilation of the findings presented in this chapter, which are summarized on the following page.

Figure 3-15. Summary graphs of mean annual temperature (A), precipitation (B), snowfall (C), and timing of peak streamflow (D) in the Greater Yellowstone Area (GYA) for the period 1950-2018. The variable line is the annual data and the straight lines are regression lines showing the trends over the period. The graphs show that the upward trend in temperature is mirrored by a downward trend in snowfall and progressively earlier dates of peak streamflow in the GYA. Mean annual precipitation has not changed substantially.
When averaged across all the records, climate and hydrologic measurements show significant changes in the region since 1950:
-
Mean annual temperature in the GYA has increased by 2.3°F (1.3°C) since 1950, a rate of 0.35°F (0.19°C)/decade.
-
Total annual precipitation in the GYA has not changed substantially, but the distribution throughout the year has changed with increases in spring and fall and decreases in summer and winter.
-
Peak precipitation has shifted from May and June to April and May.
-
Average annual snowfall has declined by 3.5 inches (8.9 cm)/decade and is now greater in December and February than in January.
-
Measurable snowfall has become rare in June and September as the snow-free season has lengthened.
-
Annual streamflow today is similar to the mid-20th century, but the timing of peak flow now occurs 8 days earlier.
-
The shift in the timing of peak streamflow since 1970 has been approaching the early timing that occurred during the 1930s Dust Bowl drought. The recent shift, however, is caused by rising spring temperatures that melt snow earlier, whereas during the Dust Bowl drought it was caused by a year-round decline in precipitation.
-
In selected free-flowing rivers in the GYA since the mid-20th century annual flows have decreased by 3-11%, spring flows have increased by 30-80%, and summer and fall minimum flows have declined by 10-40%.
Some trends differ by elevation and watershed:
-
Mean annual temperatures in the Missouri Headwaters and Upper Snake watersheds are now similar to those of the Big Horn watershed, which historically was the warmest subregion of the GYA.
-
In the wettest watershed of the GYA, the Snake River headwaters, annual precipitation has increased, but annual snowfall has declined.
-
In the coolest watershed of the GYA, the Upper Green, annual average temperatures have risen from near freezing in the 1950s to the upper 30s°F (1-5°C) in the 2010s, causing a reduction in snowfall even though there has been little change in annual precipitation totals.
-
Snowfall has changed in amount and distribution. It has declined at most elevations, including between 6000-7000 ft (1800-2100 m), where it used to be greatest but where today mean annual temperatures are 2.5°F (1.4°C) higher than the 1980s. The lone exception is above 7000 ft (2100 m) elevation, where snowfall has increased and is now the greatest.
-
Long-term streamflow trends are small, but increases in some rivers, such as the Yellowstone, Gallatin, and Madison, contribute to a regional average increase in streamflow of less than 10% since 1925.
Literature Cited
Baker JM, Everett Y, Liegel L, Van Kirk R. 2014. Patterns of irrigated agricultural land conversion in a western US watershed: implications for landscape-level water management and land-use planning. Society and Natural Resources: An International Journal 27(11):1145-60.
Benjamin L. 2000. Groundwater hydrology of the Henry’s Fork springs. Intermountain Journal of Sciences 6(3):119-42.
Boggs KG, Van Kirk RW, Johnson GS, Fairley JP, Porter PS. 2010. Analytical solutions to the linearized Boussinesq equation for assessing the effects of recharge on aquifer discharge. Journal of the American Water Resources Association 46(6):1116-32.
Brutsaert W. 2006. Indications of increasing land surface evaporation during the second half of the 20th century. Geophysical Research Letters 33(20):1-4. https://doi.org/10.1029/2006GL027532.
Burnett BN. 2020. Fluvial geomorphic and hydrologic evolution and climate change resilience in young volcanic landscapes: Rhyolite Plateau and Lamar Valley, Yellowstone National Park [PhD dissertation]. Diss. Albuquerque NM: The University of New Mexico, Department of Earth and Planetary Sciences. 160 p. Available online https://digitalrepository.unm.edu/cgi/viewcontent.cgi?article=1292&cont…. Accessed 10 Mar 2021.
Chang T, Hansen AJ. 2015. Historic and projected climate change in the greater Yellowstone ecosystem. Yellowstone Science 23(1):14-9.
Chang T, Hansen A, Piekielek N. 2014. Patterns and variability of suitable bioclimate habitat for Pinus albicaulis under multiple projected climate models. PLOS ONE 9(11):e111669.
Cheesbrough KS. 2007. Glacial recession in Wyoming’s Wind River Range [MS thesis]. Lander WY: University of Wyoming, Department of Civil and Architectural Engineering. 63 p. Available online http://mediad.publicbroadcasting.net/p/wpr/files/chesseborough_thesis.p…. Accessed 10 Mar 2021.
Cook ER, Seager R, Heim Jr RR, Vose RS, Herweijer C, Woodhouse C. 2010. Megadroughts in North America: placing IPCC projections of hydroclimatic change in a long-term palaeoclimate context. Journal of Quaternary Science 25(1):48-61.
Dudley RW, Hodgkins GA, McHale MR, Kolian MJ, Renard B. 2017. Trends in snowmelt-related streamflow timing in the conterminous United States. Journal of Hydrology 547:208-21.
Eberts SM, Woodside MD, Landers MN, Wagner CR. 2018. Monitoring the pulse of our nation’s rivers and streams—the US Geological Survey streamgaging network. US Geological Survey fact sheet 2018-3081. Reston VA: USGS. 2 p. https://doi.org/10.3133/fs20183081.
Emanuel RE, Epstein HE, McGlynn BL, Welsch DL, Muth DJ, D’Odorico P. 2010. Spatial and temporal controls on watershed ecohydrology in the northern Rocky Mountains. Water Resources Research 46(11):W11553. doi:10.1029/2009WR008890.
Fall S, Watts A, Nielsen‐Gammon J, Jones E, Niyogi D, Christy JR, Pielke Sr RA. 2011. Analysis of the impacts of station exposure on the US Historical Climatology Network temperatures and temperature trends. Journal of Geophysical Research: Atmospheres 116(D14). https://doi.org/10.1029/2010JD015146.
Fiebrich CA. 2009. History of surface weather observations in the United States. Earth Science Reviews 93(3-4):77-84.
Frisbee MD, Phillips FM, Campbell AR, Liu F, Sanchez SA. 2011. Streamflow generation in a large, alpine watershed in the southern Rocky Mountains of Colorado: is streamflow generation simply the aggregation of hillslope runoff responses? Water Resources Research 47(6):W06512. doi:10.1029/2010WR009391.
Gardner WP, Susong DD, Solomon DK, Heasler H. 2010. Snowmelt hydrograph interpretation: revealing watershed scale hydrologic characteristics of the Yellowstone volcanic plateau. Journal of hydrology 383(3-4):209-22.
Golubev VS, Lawrimore JH, Groisman PY, Speranskaya NA, Zhuravin SA, Menne MJ, Peterson TC, Malone RW. 2001. Evaporation changes over the contiguous United States and the former USSR: a reassessment. Geophysical Research Letters 28(13):2665-8. https://doi.org/10.1029/2000GL012851.
Gosnell H, Haggerty JH, Travis WR. 2006. Ranchland ownership change in the Greater Yellowstone Ecosystem, 1990-2001: implications for conservation. Society and Natural Resources 19(8):743-58.
Hansen AJ, Rotella JJ. 2002. Biophysical factors, land use, and species viability in and around nature reserves. Conservation Biology 16(4):1112-22.
Hoekema DJ, Sridhar V. 2013. A system dynamics model for conjunctive management of water resources in the Snake River basin. Journal of the American Water Resources Association 49(6):1327-50.
Hoerling M, Barsugli J, Livneh B, Eischeid J, Quan X, Badger A. 2019. Causes for the century-long decline in Colorado River flow. Journal of Climate 32(23):8181-203.
Johnson GS, Sullivan WH, Cosgrove DM, Schmidt RD. 1999. Recharge of the Snake River Plain aquifer: transitioning from incidental to managed. Journal of the American Water Resources Association 35(1):123-31.
Kendy E, Bredehoeft JD. 2006. Transient effects of groundwater pumping and surface-water-irrigation returns on streamflow. Water Resources Research 42(8). https://doi.org/10.1029/2005WR004792.
Klos PZ, Link TE, Abatzoglou JT. 2014. Extent of the rain‐snow transition zone in the western US under historic and projected climate. Geophysical Research Letters 41(13):4560-8.
Knowles N, Dettinger MD, Cayan D. 2006. Trends in snowfall versus rainfall for the western United States, 1949-2001. Journal of Climate 19(18):4545-59.
Leppi JC, DeLuca TH, Harrar SW, Running SW. 2012. Impacts of climate change on August stream discharge in the central Rocky Mountains. Climatic Change 112(3-4):997-1014.
Lins HF. 2012. USGS HHydro-Climatic Data Network 2009 (HCDN–2009). US Geological Survey fact sheet 2012-3047. 4 p. Available online https://pubs.usgs.gov/fs/2012/3047/. Accessed 20 Dec 2020.
Livneh B, Badger AM. 2020. Drought less predictable under declining future snowpack. Nature Climate Change 10:452-8.
Lonsdale WR, Cross WF, Dalby CE, Meloy SE, Schwend AC. 2020. Evaluating irrigation efficiency: toward a sustainable water future for Montana [report[. Bozeman MT: Montana State University, Montana University System Water Center. 44 p. doi:10.15788/mwc202011.
Mahmood R, Foster SA, Logan D. 2006. The GeoProfile metadata, exposure of instruments, and measurement bias in climatic record revisited. International Journal of Climatology 26(8):1091-124. doi:10.1002/joc.1298
Marston RA, Pochop LO, Kerr GL, Varuska ML, Veryzer DJ. 1991. Recent glacier changes in the Wind River Range, Wyoming. Physical Geography 12(2):115-23.
Martin JT, Pederson GT, Woodhouse CA, Cook ER, McCabe GJ, Anchukaitis KJ, Wise EK, Erger PJ, Dolan L, McGuire M, Gangopadhyay S, Chase KJ, Littell JS, Gray ST, St. George S, Friedman JM, Sauchyn DS, St-Jacques J-M, King J. 2020. Increased drought severity tracks warming in the United States’ largest river basin. Proceedings of the National Academy of Sciences 117(21):11328-36.
McCabe GJ, Clark MP. 2005. Trends and variability in snowmelt runoff in the western United States. Journal of Hydrometeorology 6(4):476-82.
McMenamin SK, Hadly EA, Wright CK. 2008. Climatic change and wetland desiccation cause amphibian decline in Yellowstone National Park. Proceedings of the National Academy of Sciences USA 105(44):16988-93.
McNamara JP, Chandler D, Seyfried M, Achet S. 2005. Soil moisture states, lateral flow, and streamflow generation in a semi‐arid, snowmelt‐driven catchment. Hydrological Processes: An International Journal 19(20):4023-38.
Meyer GA. 2001. Recent large-magnitude floods and their impact on valley-floor environments of northeastern Yellowstone. Geomorphology 40(3-4):271-90.
Middleton AD, Kauffman MJ, McWhirter DE, Cook JG, Cook RC, Nelson AA, Jimenez MD, Klaver RW. 2013. Animal migration amid shifting patterns of phenology and predation: lessons from a Yellowstone elk herd. Ecology 94(6):1245-56.
Milly PCD, Dunne KA. 2020. Colorado River flow dwindles as warming-driven loss of reflective snow energizes evaporation. Science 367:1252-5.
Minshall GW, Brock JT. 1991. Observed and anticipated effects of forest fire on Yellowstone stream ecosystems. In: Keiter RB (author), Mark S. Boyce MS editor. The Greater Yellowstone Ecosystem: redefining America’s wilderness heritage. p 123-35. London UK: Yale University Press.
Moore JN, Harper JT, Greenwood MC. 2007. Significance of trends toward earlier snowmelt runoff, Columbia and Missouri basin headwaters, western United States. Geophysical Research Letters 34(16):1-5. https://doi.org/10.1029/2007GL031022.
Mote PW, Li S, Lettenmaier DP, Xiao M, Engel R. 2018. Dramatic declines in snowpack in the western US. npj Climate and Atmospheric Science 1(1):1-6.
National Research Council. 1998. Future of the National Weather Service Cooperative Observer Network. Washington DC: National Academies Press. 65 p. Available online https://www.nap.edu/read/6197/chapter/1. Accessed 10 Mar 2021.
Nolan BT, Miller KA. 1995. Water resources of Teton County, Wyoming, exclusive of Yellowstone National Park. US Geological Survey water-resources investigations report 95-4204. Denver CO: USGS. 76 p. doi:10.3133/wri954204.
Notaro M, Emmett K, O’Leary D. 2019. Spatio-temporal variability in remotely sensed vegetation greenness across Yellowstone National Park. Remote Sensing 11(7):798. doi.10.3390/rs11070798.
[NPS] National Park Service. [undated]. 1988 fires [webpage]. Available online https://www.nps.gov/yell/learn/nature/1988-fires.htm. Accessed 30 Apr 2021.
Pagano T, Garen D, Sorooshian S. 2004. Evaluation of official western US seasonal water supply outlooks, 1922-2002. Journal of Hydrometeorology 5(5):896-909.
Pederson GT, Gray ST, Ault T, Marsh W, Fagre DB, Bunn AG, Woodhouse CA, Graumlich LJ. 2011a. Climatic controls on the snowmelt hydrology of the northern Rocky Mountains. Journal of Climate 24(6):1666-87.
Pederson GT, Gray ST, Woodhouse CA, Betancourt JL, Fagre DB, Littell JS, Watson E, Luckman BH, Graumlich LJ. 2011b. The unusual nature of recent snowpack declines in the North American Cordillera. Science 333:332-5.
Peterson K. 2010. An analytical model of surface water/groundwater interactions in a western watershed experiencing changes to water and land use [MS thesis]. Arcata CA: Humboldt State University, Environmental Systems. 99 p. Available online http://humboldt-dspace.calstate.edu/bitstream/handle/2148/808/KimberlyP…. Accessed 10 Mar 2021.
Pielke Sr R, Nielsen-Gammon J, Davey C, Angel J, Bliss O, Doesken N, Cai M, Fall S, Niyogi D, Gallo K, Hale R, Hubbard KG, Lin X, Li H, Raman S. 2007. Documentation of uncertainties and biases associated with surface temperature measurement sites for climate change assessment. Bulletin of the American Meteorological Society 88(6):913-28.
Pierce KL, Morgan LA, Link PK. 1992. The track of the Yellowstone hot spot: volcanism, faulting, and uplift [chapter 1]. In: Link PK, Kuntz MA, Piatt LB, editors. GSA Memoirs—Regional geology of eastern Idaho and western Wyoming. p 1-53. Boulder CO: Geological Society of America. https://doi.org/10.1130/MEM179-p1.
Potter C. 2020. Snowmelt timing impacts on growing season phenology in the northern range of Yellowstone National Park estimated from MODIS satellite data. Landscape Ecology 35(2):373-88.
Ray AM, Sepulveda AJ, Irvine KM, Wilmoth SK, Thoma DP, Patla DA. 2019. Wetland drying linked to variations in snowmelt runoff across Grand Teton and Yellowstone national parks. Science of the Total Environment 666:1188-97.
Romme WH, Turner MG. 1991. Implications of global climate change for biogeographic patterns in the Greater Yellowstone Ecosystem. Conservation Biology 5(3):373-86.
Rye RO, Truesdell AH. 2007. The question of recharge to the deep thermal reservoir underlying the geysers and hot springs of Yellowstone National Park [chapter H]. In: Morgan LA, editor. Integrated geoscience studies in the Greater Yellowstone Area—volcanic, tectonic, and hydrothermal processes in the Yellowstone geoecosystem. USGS professional paper 1717-H. Renton VA: USGS. 32 p. doi:10.3133/pp1717H.
Schmidt JC, White MA. 2003. The hydrologic regime of the Snake River in Grand Teton National Park [report to the National Park Service]. Available as draft report online http://files.cfc.umt.edu/cesu/NPS/USU/2003/Schmidt03/Snake%20River%20hy…. Accessed 10 Mar 2021.
Schook DM, Cooper DJ. 2014. Climatic and hydrologic processes leading to wetland losses in Yellowstone National Park, USA. Journal of Hydrology 510:340-52.
Shuman B. 2012. Recent Wyoming temperature trends, their drivers, and impacts in a 14,000-year context. Climatic Change 112(2):429-47.
Stewart IT, Cayan DR, Dettinger MD. 2005. Changes toward earlier streamflow timing across western North America. Journal of Climate 18(8):1136-55. https://doi.org/10.1175/JCLI3321.1.
Sturm M, Taras B, Liston GE, Derksen C, Jonas T, Lea J. 2010. Estimating snow water equivalent using snow depth data and climate classes. Journal of Hydrometeorology 11(6):1380-94.
Tercek MT, Rodman AW, Thoma D. 2015. Trends in Yellowstone snowpack. Yellowstone Science 23(1):20-7.
Udall B, Overpeck, J. 2017. The twenty-first century Colorado River hot drought and implications for the future. Water Resources Research 53(3):2404-18.
[USGS] US Geological Survey. [undated]. Combined wildfire datasets for the United States and certain territories, 1878-2019. Available online https://www.sciencebase.gov/catalog/item/5ee13de982ce3bd58d7be7e7. Accessed 13 May 2021.
Van Kirk RW, Benjamin L. 2001. Status and conservation of salmonids in relation to hydrologic integrity in the Greater Yellowstone Ecosystem. Western North American Naturalist 61(3):359-74.
Van Kirk RW, Contor BA, Morrisett CN, Null SE, Loibman AS. 2020. Potential for managed aquifer recharge to enhance fish habitat in a regulated river. Water 12(3):673.
Venn BJ, Johnson DW, Pochop LO. 2004. Hydrologic impacts due to changes in conveyance and conversion from flood to sprinkler irrigation practices. Journal of Irrigation and Drainage Engineering 130(3):192-200.
Whitlock C, Bartlein PJ. 1993. Spatial variations of Holocene climate change in the Yellowstone region. Quaternary Research 39(2):231-8.
Zelt RB, Boughton G, Miller KA, Mason JP, Gianakos LM. 1999. Environmental setting of the Yellowstone River Basin, Montana, North Dakota, and Wyoming. US Geological Survey water-resources investigations report 98-4269. Denver CO: USGS. 120 p. Available online https://pubs.usgs.gov/wri/wri984269/wri984269.pdf. Accessed 10 Mar 2021.
[1] The Ruby River is part of the Missouri Headwaters HUC6 unit. The Ruby River and other rivers mentioned in this section were described in Chapter 1.
[2] The average dates shown Figure 3-12B were used to calculate the differences in Figure 3-12A.

Early season snowmelt in the Wyoming Range. Photo courtesy of Scott Bischke.