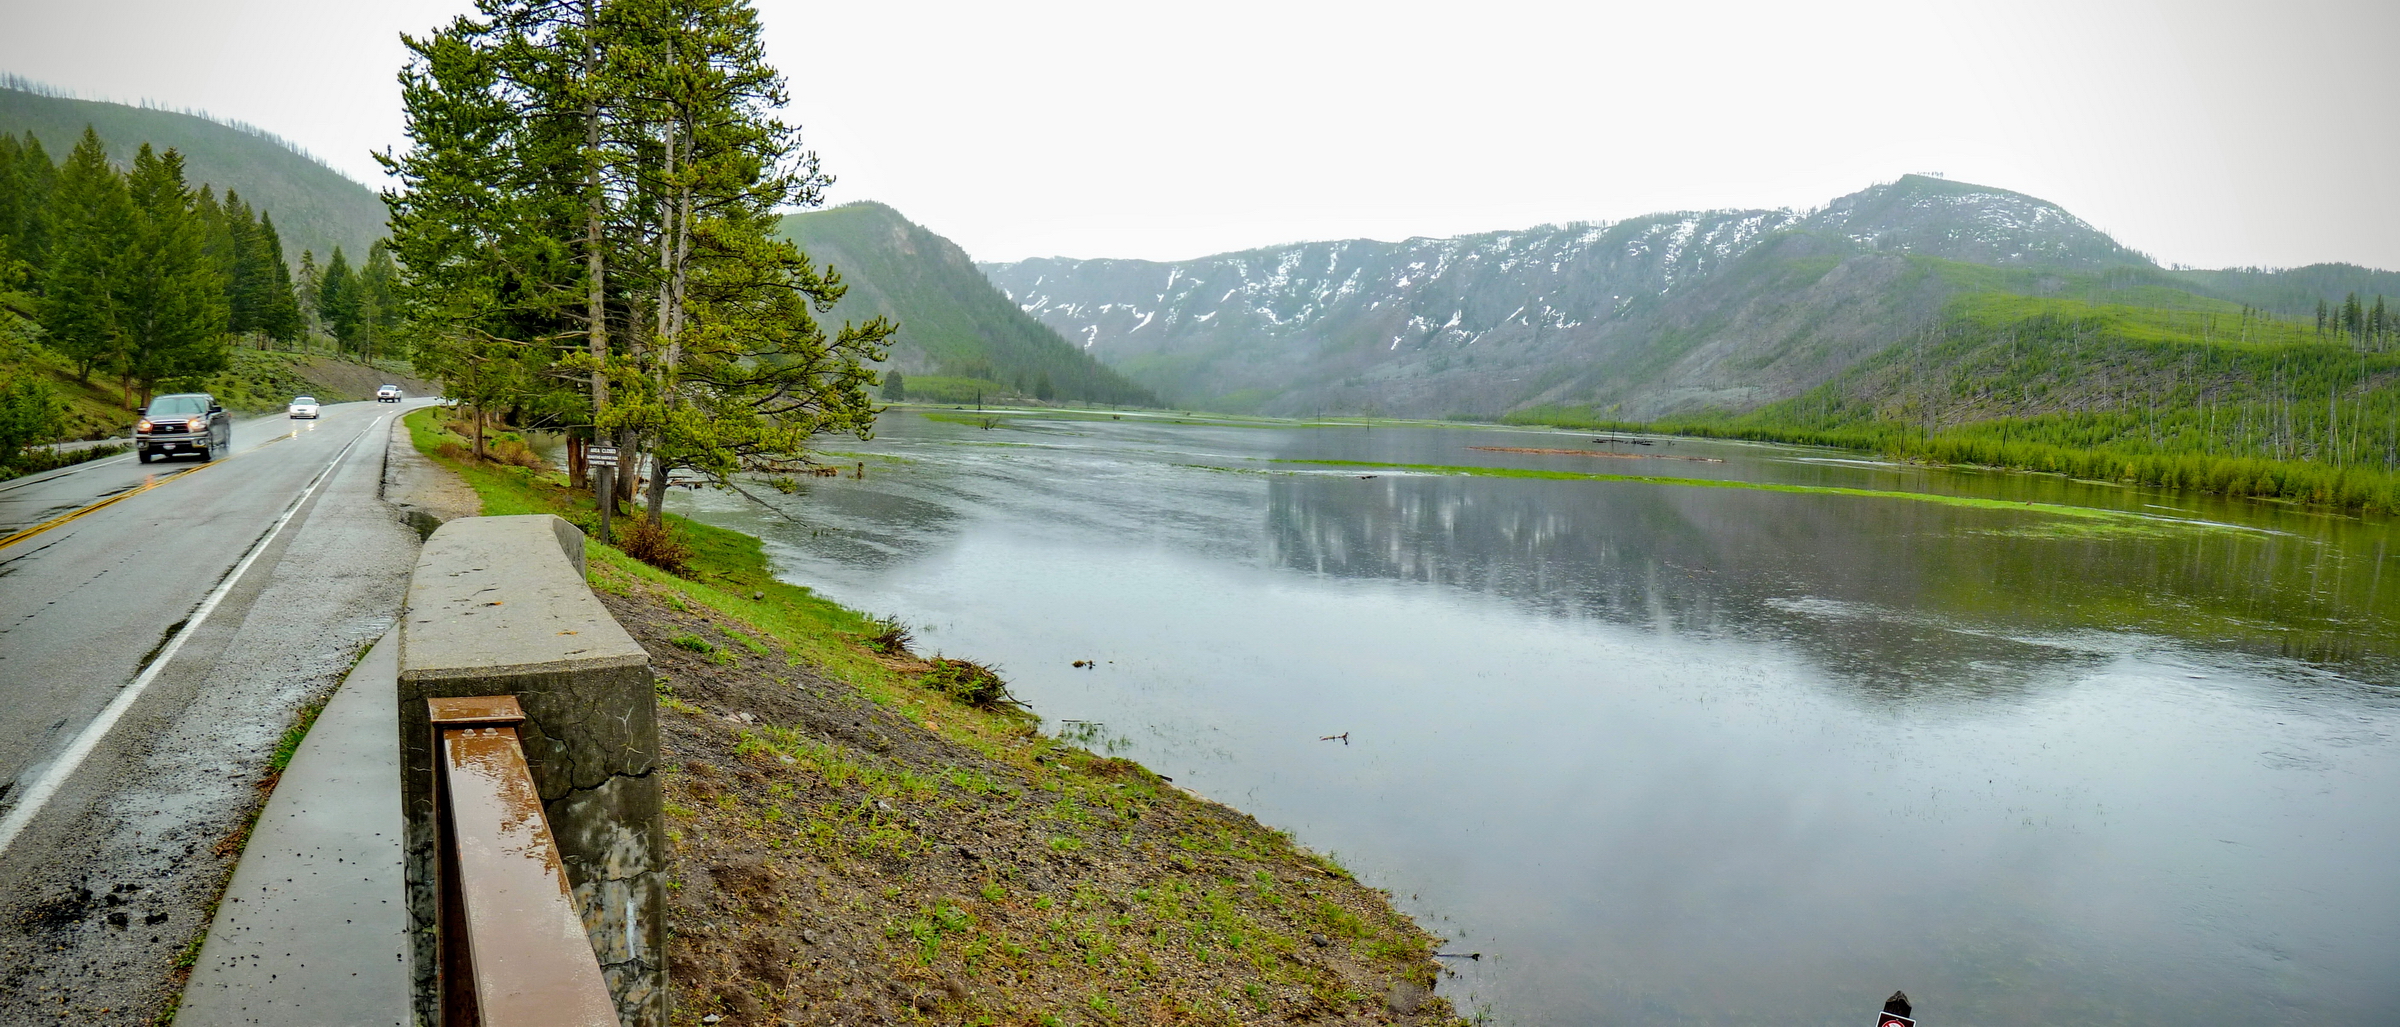
Madison River in spring flood, here at 7-mile bridge in Yellowstone National Park, near West Yellowstone MT. Photo courtesy of Scott Bischke.
Key Messages
-
Snow governs the annual water cycle of GYA. Under RCP4.5, the total area of the GYA dominated by winter snowfall decreases from 59% during the base period (1986-2005) to 27% at mid century (2041-2060) and to 11% by the end of century (2081-2099). Under RCP8.5, the extent of snow-dominant area decreases to 17% and to 1% for the same time periods, respectively. [high confidence, 100% model agreement and SNR >1]
-
Total annual runoff in GYA is projected to increase by about 1% by mid century (2041-2060) and by 2% at the end of century (2081-2099) under RCP4.5, and increase by 2% and 3% for same time periods, respectively, under RCP8.5. [low to medium confidence, <60% to 80% model agreement, SNR <1]
-
The seasonality of runoff is projected to change as snowfall declines and snowpack melts earlier under both RCP4.5 and RCP8.5. [high confidence, >80% model agreement and SNR >1]
-
The biggest changes are at mid and high elevations where runoff from snowmelt increases in spring (March through May) and decreases in summer (June through August). Timing of peak runoff is projected to shift by 1-2 months earlier in the year in the later part of the century under RCP8.5. [high confidence, >80% model agreement and SNR >1 ]
-
On an annual basis, precipitation (P) over the GYA exceeds potential evapotranspiration (PET), but the reverse is true in summer, particularly at lower elevations, leading to a seasonal water deficit that is projected to increase in the future. [high confidence, >80% model agreement and SNR >1]
-
Summer PET is projected to increase in the future so the summer water deficit is projected to increase by 25% by mid century (2041-2060) and by 36% at the end of century (2081-2099) under RCP4.5. Under RCP8.5, projected deficit increases are 35% by mid century and 79% by the end of century. [high confidence, >80% model agreement and SNR >1]
-
For the 1986-2005 base period over the GYA, modeled summer soil moisture levels are about 25% of capacity at low elevations and 50% of capacity at higher elevations. Under RCP4.5 June-October soil moisture saturation decreases by 23% mid century and 33% by the end of the century. Under RCP8.5 June-October soil moisture saturation decreases by 30% at mid century and 56% by the end of the century [high confidence, > 80% model agreement and SNR >1]
Water balance is the difference between water gains and losses over an area like the GYA or a HUC6 watershed. Gains come from precipitation in the form of rain, sleet, or snow. Losses occur through runoff (draining away of water on the surface), evapotranspiration (evaporation from bare soils plus transpiration from vegetation), sublimation of snow (evaporation directly from the snow without melting), and change in water stored as snowpack or in the ground. The water balance model applied here (see figure) accounts for these various components of the water balance monthly.
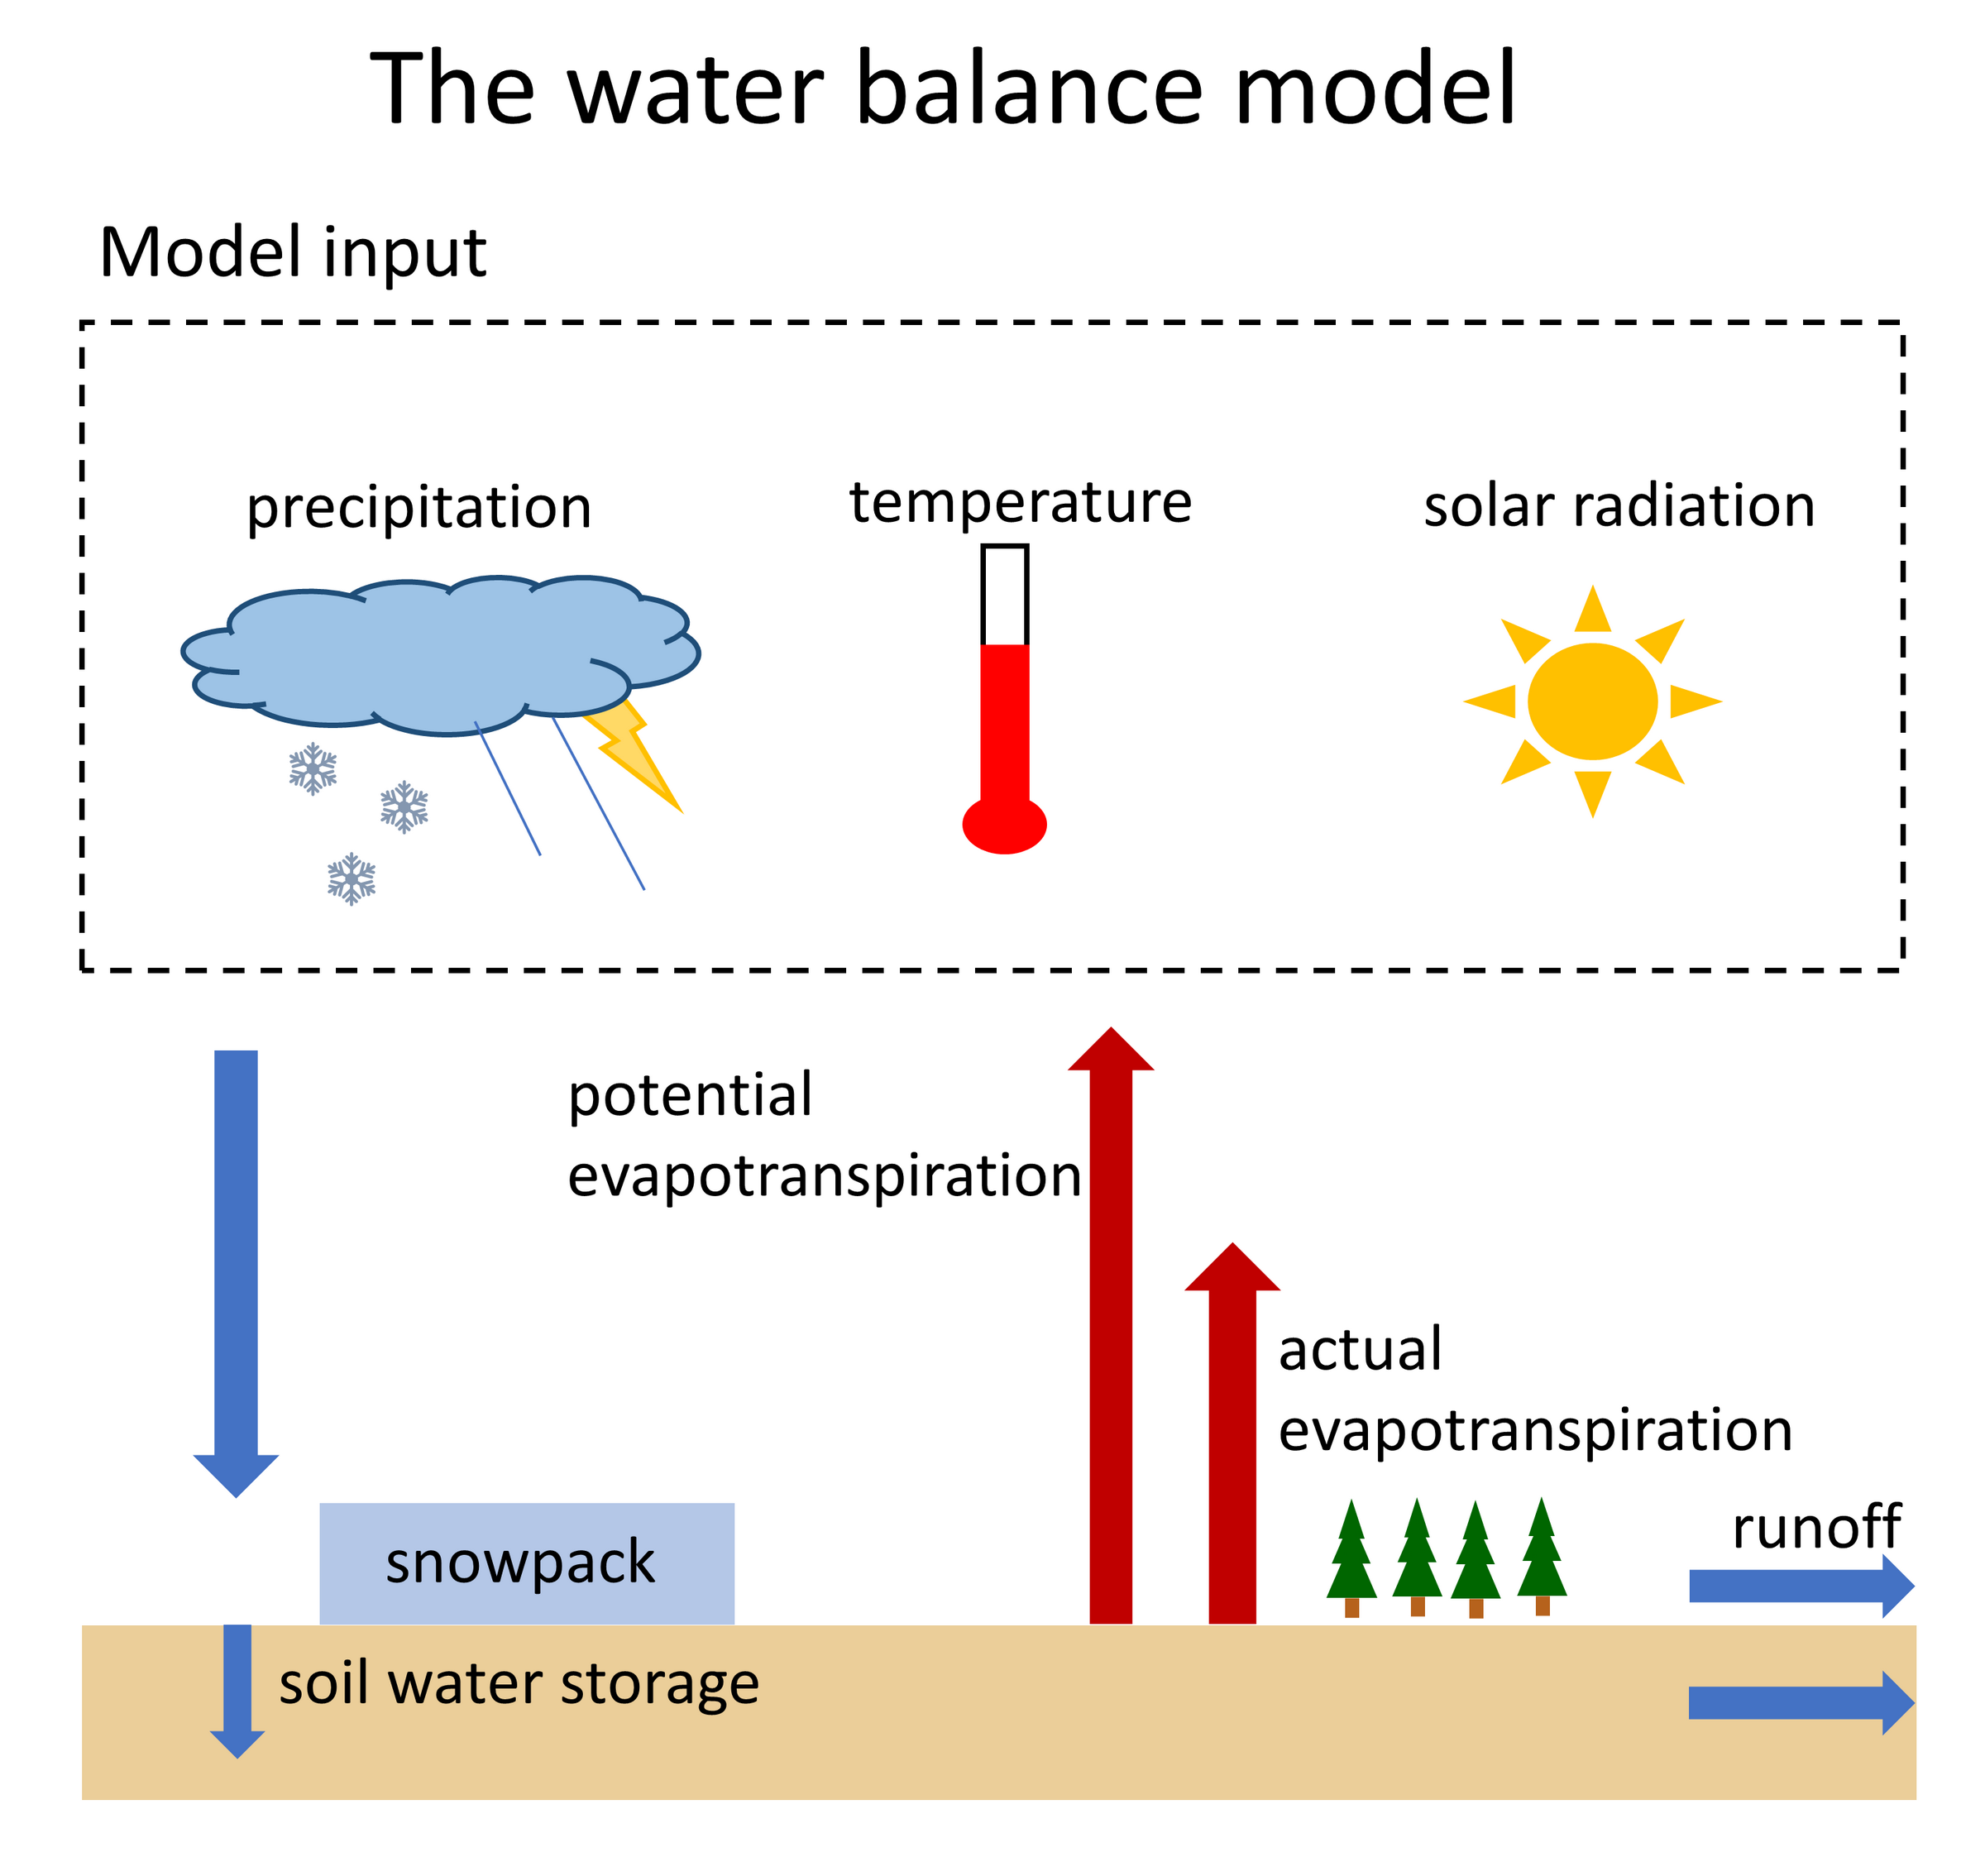
Schematic diagram of the water balance model. Monthly precipitation and temperature inputs are from the MACAv2-METDATA data set and solar radiation is determined as a function of latitude and day of year (Hostetler and Alder 2016).
-
Potential evapotranspiration (PET) is the amount of evapotranspiration that would occur if unlimited water were available, such as from an open pan of water or well irrigated crops.
-
Actual evapotranspiration is the amount of evapotranspiration that occurs under actual moisture conditions. Soil moisture is the primary limiter of water available for evapotranspiration. When soil moisture levels decline, evapotranspiration is increasingly limited as it becomes more difficult to extract water from the soil.
-
The seasonal water deficit or precipitation minus evapotranspiration (P-PET) is the difference between supply (precipitation, P) and atmospheric demand (potential evapotranspiration, PET). It is a measure of climatological wetness (P greater than PET) or dryness (P less than PET) in an area such as the GYA (McCabe and Wolock 2015; NOAA-NCEI undated).
-
Runoff is the excess water available from precipitation and snowmelt that does not get evaporated, sublimated, or absorbed in the soil. It is a depth of water in a given area (e.g., the GYA or HUC6 watersheds) that would be available for routing into streamflow and groundwater.(More detailed hydrologic models are needed to simulate routing of runoff into stream and groundwater networks.)
Additional details on the water balance model are provided in the appendix to this chapter.
Introduction
In this chapter we present aspects of projected changes in water in GYA. We apply a water balance model to evaluate climate-driven changes in the water cycle (for more detail see box and the appendix to this chapter). The relatively simple model uses monthly average air temperature and precipitation from the MACAv2-METDATA data and the seasonal cycle of potential solar radiation as inputs. The water balance model output is produced over the same 4-km (2.5-mile) grid cells as the temperature and precipitation data.
Snow
The annual water cycle of the GYA is governed by snow accumulation during winter and snowmelt during spring and summer. Summer thunderstorms frequently increase streamflows and augment soil moisture for periods of days, but snowpack determines the annual availability of water for ecosystems, agriculture, and communities in the GYA.
The annual water cycle of the GYA is governed by snow accumulation during winter and snowmelt during spring and summer… snowpack determines the annual availability of water for ecosystems, agriculture, and communities in the GYA.
As indicated by tree-ring analyses and observations (see Chapters 2 and 3), the snow regime in the GYA (and elsewhere in the West) is already changing. Precipitation in the GYA is projected to increase somewhat through the 21st century, but issues of concern for snow in the future are:
-
How much precipitation will fall as snow versus rain?
-
How much water will accumulate in, or be lost from, the snowpack?
-
What will be the rate and timing of snowmelt?
As simulated by the water balance model, ongoing changes in snow in the GYA are projected to continue into the future (Figure 7-1 and Table 7-1, also Figure A7‑1 in the appendix to this chapter). The range of colors in the time-elevation plots in Figures 7-1 and A7-1 illustrate that, just as today, future periods display trends, as well as year-to-year variability, in snow. While the overall trends among the HUC6 watersheds are similar, details—for example, the large range and evolution of the rain-to-snow transition zone—reflect both intra‑ and inter-HUC6 differences in topography, location, and variation of winter temperatures around freezing.
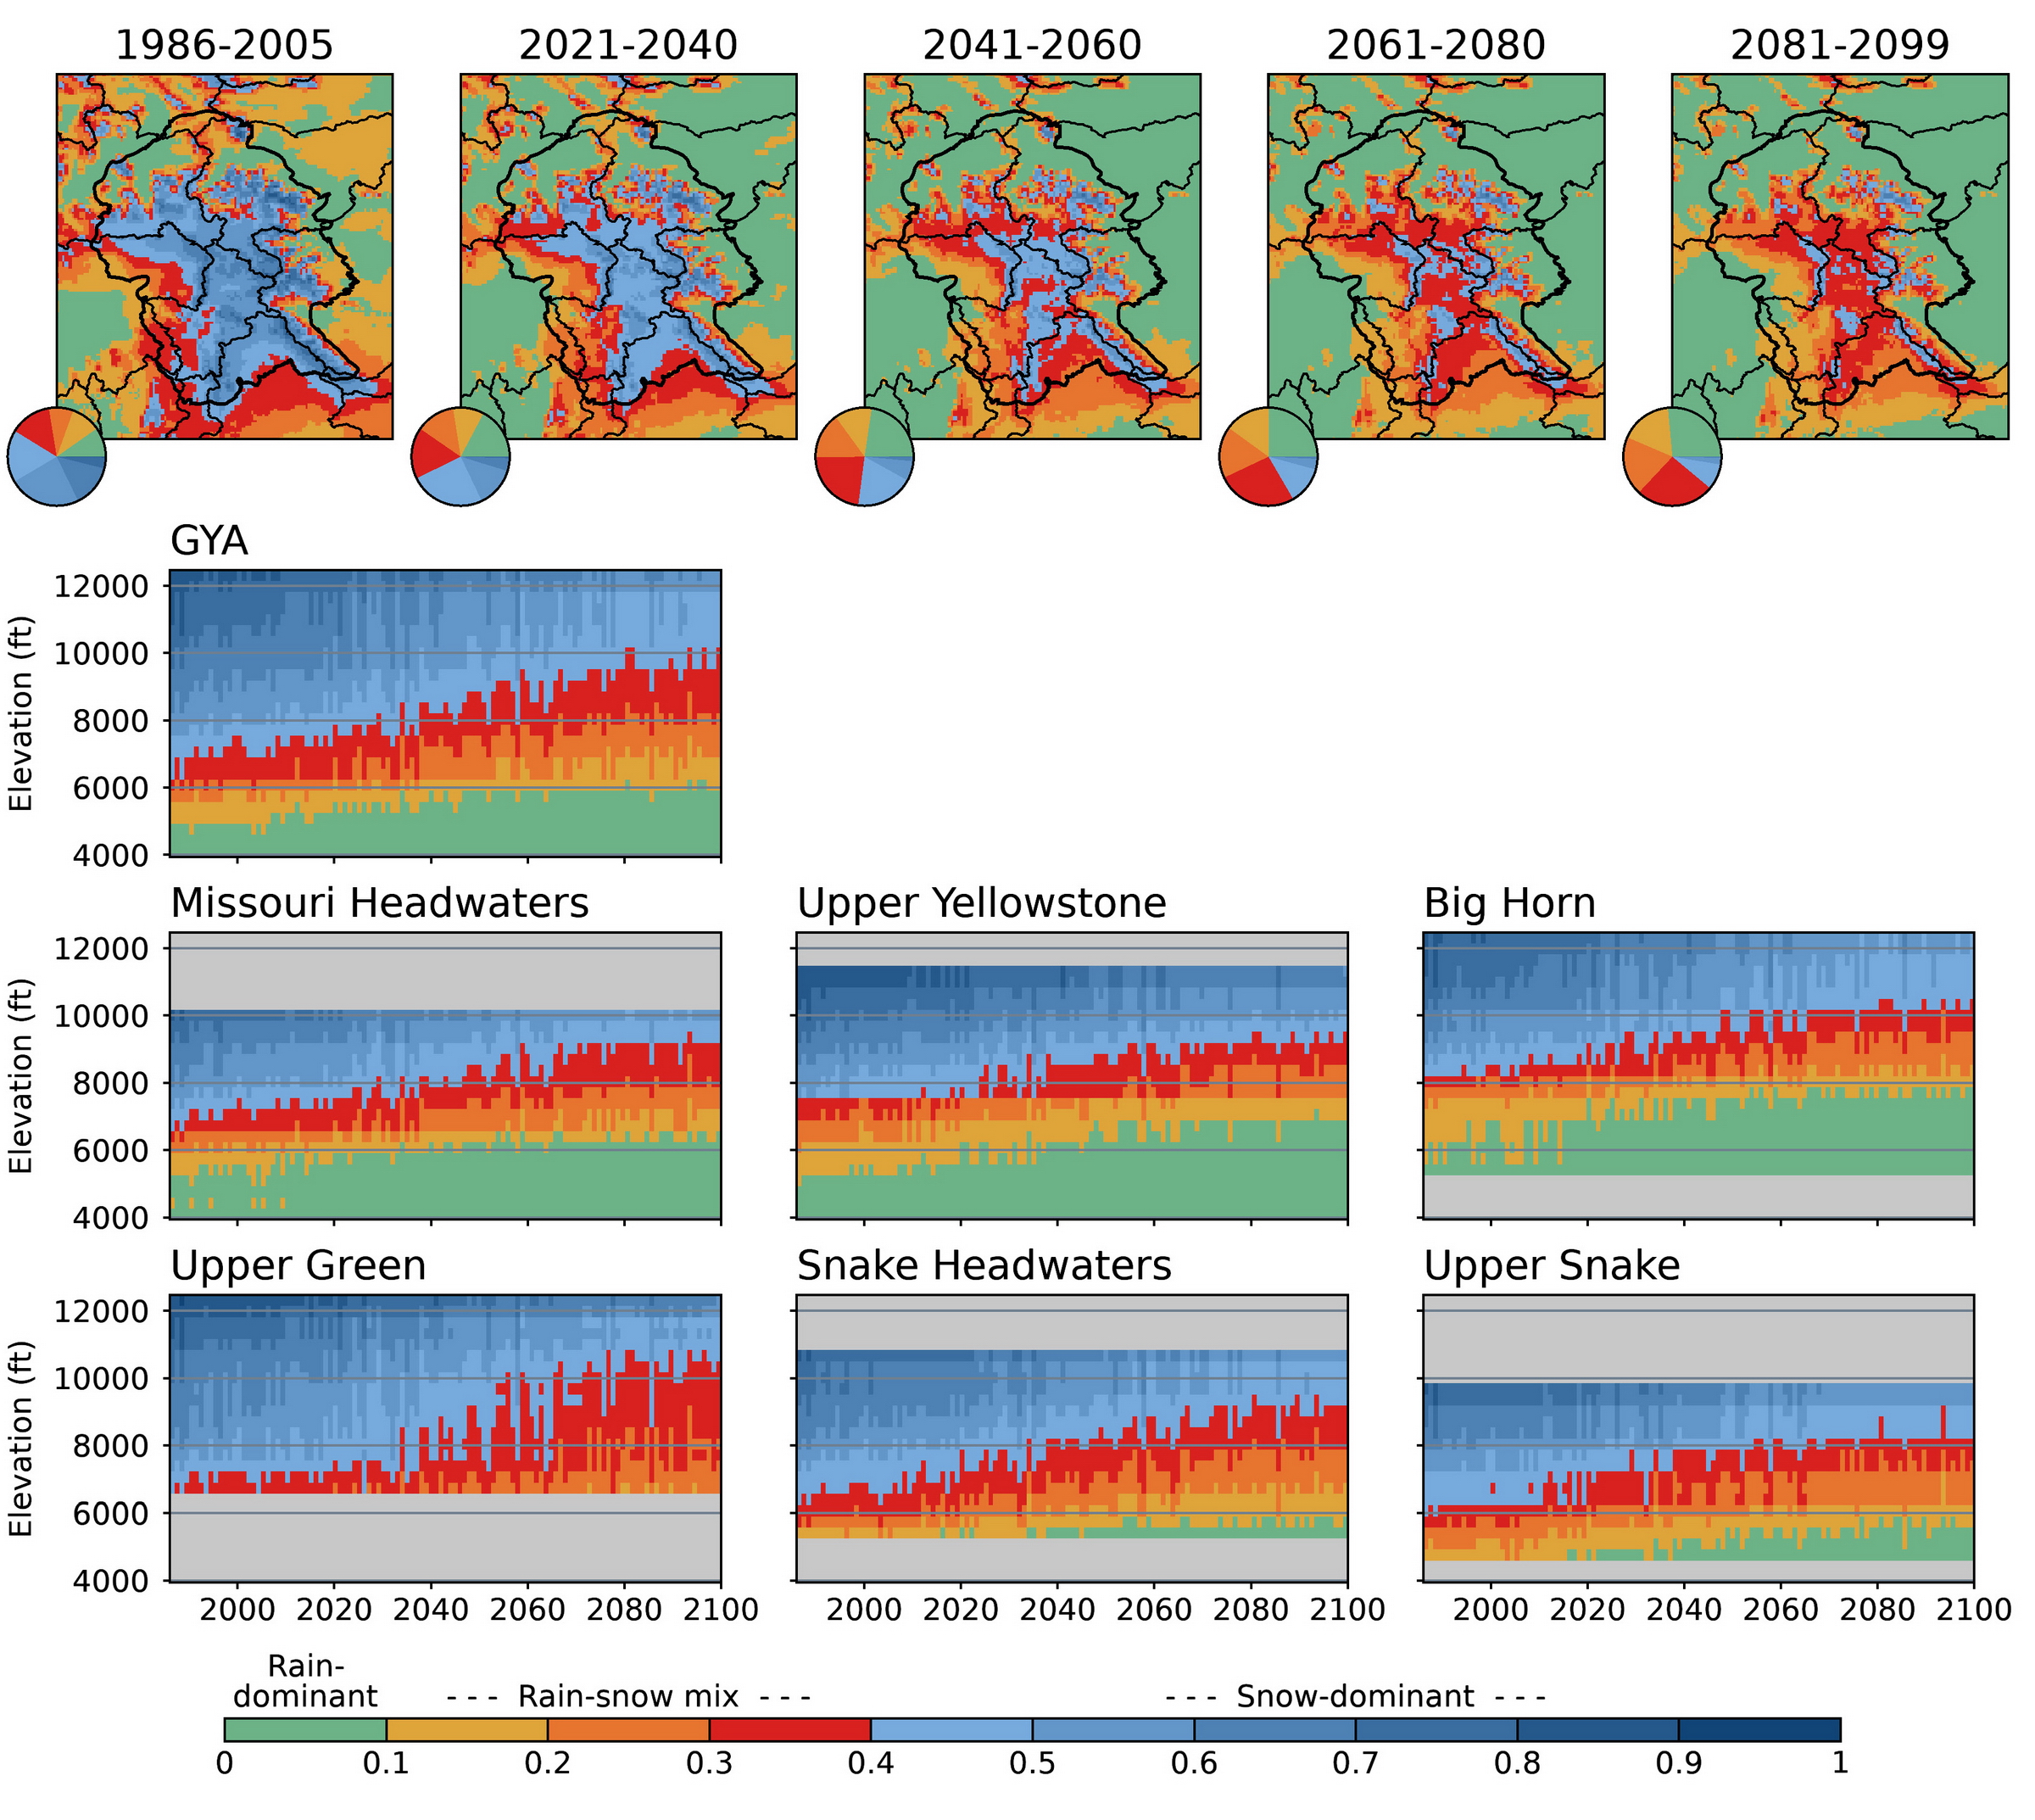
Figure 7-1. The 1986-2099 annual snow regime for the Greater Yellowstone Area and Hydrologic Unit Code 6 (HUC6) watersheds under Representative Concentration Pathway 4.5 (RCP4.5), as simulated by the water balance model. The five maps across the top display the ratio of maximum snow water equivalent (SWE) to total cold-season (Oct-Apr) precipitation (P) SWE:P for the indicated time periods (see appendix to this chapter for details on the ratio). The pie charts inset in the maps show the fraction of GYA area within each SWE:P category. The time-elevation plots for the HUC6 watersheds in the bottom two rows display the trend in SWE:P ratio from 1986-2099 averaged over 330 ft (100 m) elevation bands. Gray shading indicates elevations not present in the HUCs. See Figure A7-1 for RCP8.5.
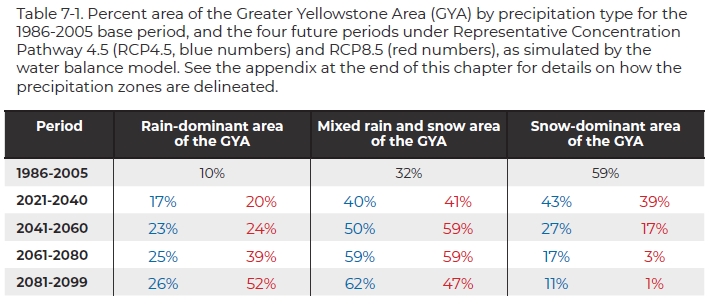
The map for the 1986-2005 base period shows that the rain-dominated zone amounts to 10% of the total area of the GYA (Table 7-1) and is characteristic of elevations below about 5000 ft (1500 m). The rain-snow mix zone amounts to 32% of the GYA and generally occurs at elevations between 5000-7000 ft (1500-2100 m), and the snow-dominant area amounts to 59% of the area above 7000 ft (2100 m). There is a progressive upward elevational shift in these zones in response to the warming under both RCPs. Under RCP4.5, by mid century (2041-2060) the area dominated by rain more than doubles to 23%, the area of rain-snow mix increases from 32% to 50%, and the snow‑dominant area shrinks from 59% to 27% of the total area. By the end of century, the area of rain-snow mix increases to 62% and the snow-dominant area is further reduced to 11%. These changes stabilize around 2070 and, at the end of century, only areas above about 9000 ft (2700 m) remain snow dominant. The trends are more dramatic under RCP8.5 (Table 7-1, also Figure A7-1 in the appendix to this chapter). By 2041-2060, the loss of the snow-dominant areas under RCP8.5 are similar to those of RCP4.5 for the 2061-2080 period, and by the end of century snow-dominant areas are lost except at the highest elevations of the Upper Yellowstone and Upper Green watersheds.
The 21st-century changes in the distribution of the snow regime in the HUC6 watersheds shown in Figures 7-1 and A7-1 are summarized by trends in the amount of liquid water stored in the snowpack (snow water equivalent, or SWE) on April 1st (Figure 7-2). All watersheds exhibit statistically significant negative trends in the SWE over the 1986-2005 base period that continue through the 21st century under both RCPs. Under RCP4.5, mid‑century (2041-2060) decreases range from about 24% (from 3.1 inches [7.9 cm] to 2.4 inches [6.1 cm]) in the Upper Yellowstone and Big Horn watersheds to about 30% in the western Upper Snake and Missouri Headwaters watersheds; by the end of century (2081-2099) the decreases range from 38% in the Upper Yellowstone and Big Horn watersheds to 44% in the Upper Snake and Missouri Headwaters watersheds. Under RCP8.5, mid‑century decreases range from 31% in the Big Horn and Upper Green watersheds to 39% in the Upper Snake and Missouri Headwaters watersheds, and by the end of century decreases range from 65% in the Upper Yellowstone to 73% in the Upper Snake and Missouri Headwaters watersheds.
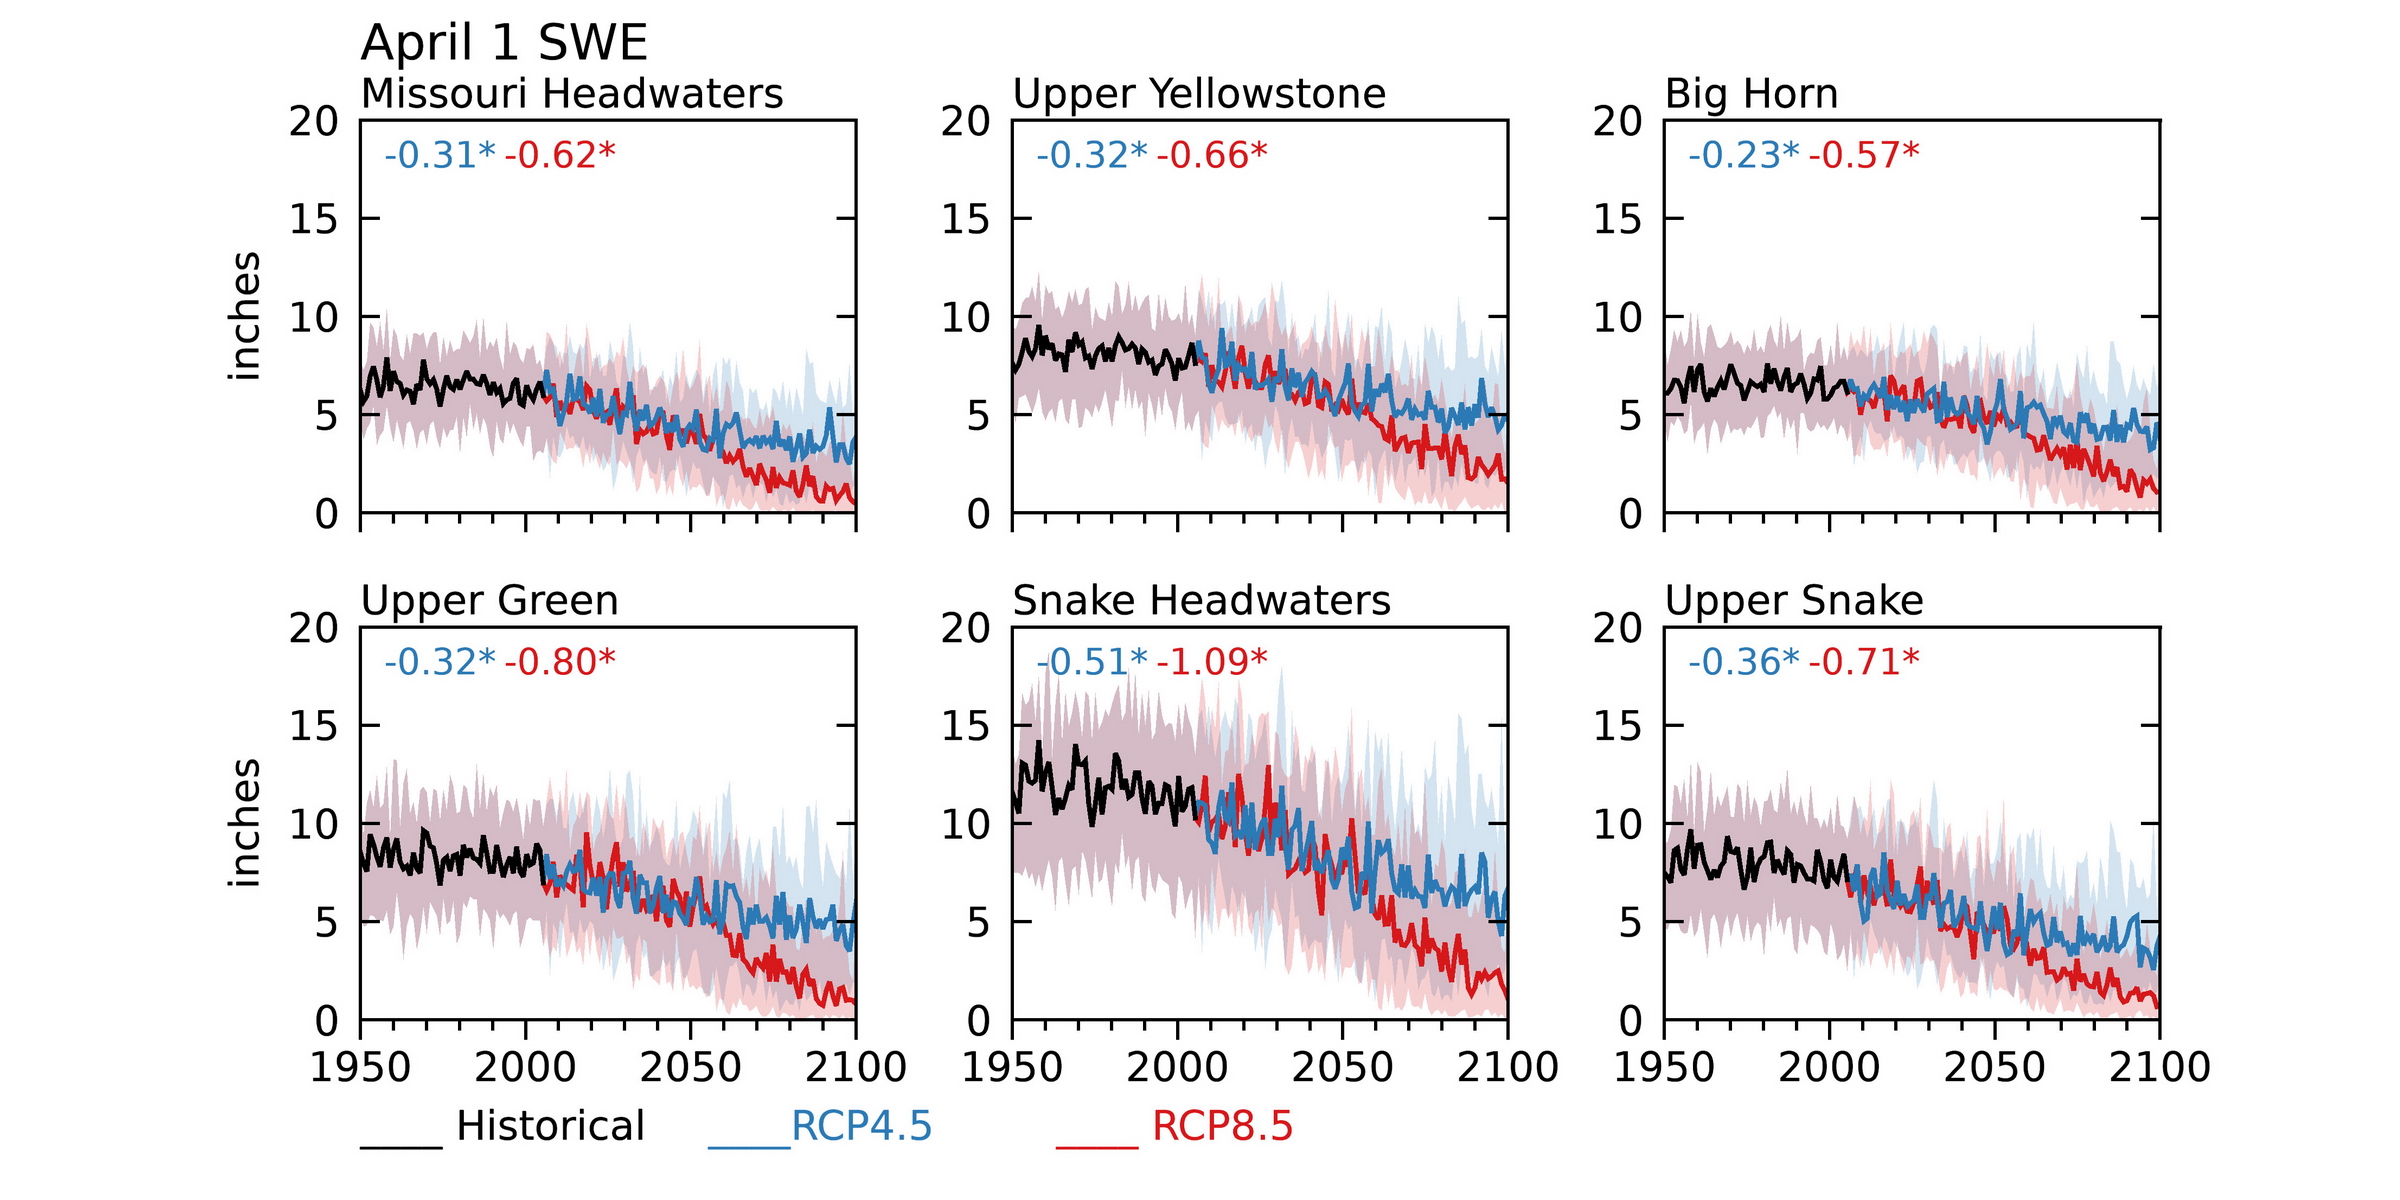
Figure 7-2. Time-series plots of the 1950-2099 April 1 amount of water stored in the snowpack (snow water equivalent, or SWE), as simulated by the water balance model. The solid lines are the medians of the 20 simulations that used the MACAv2-METDATA data, from 1950-2005 (black line), and 2006-2099 for Representative Concentration Pathway 4.5 (RCP4.5, blue line) and RCP8.5 (red line). The shaded bands around the lines are the 10th (lower) and 90th (upper) percentiles of the models. The first number in the inset in each panel is the trend (in inches/decade) for RCP4.5 and the second number is the trend for RCP8.5. An asterisk indicates that the trend is statistically significant at a 95% confidence level.
Checkerboard plots further illustrate changes in SWE in the HUC6 watersheds (Figure 7-3). As in the previous checkerboard figures, each rectangular grid illustrates the differences (anomalies) between a given period and the base period (e.g., 2021-2040 minus 1986-2005) broken down by monthly and annual means, for the GYA and each HUC6 watershed.
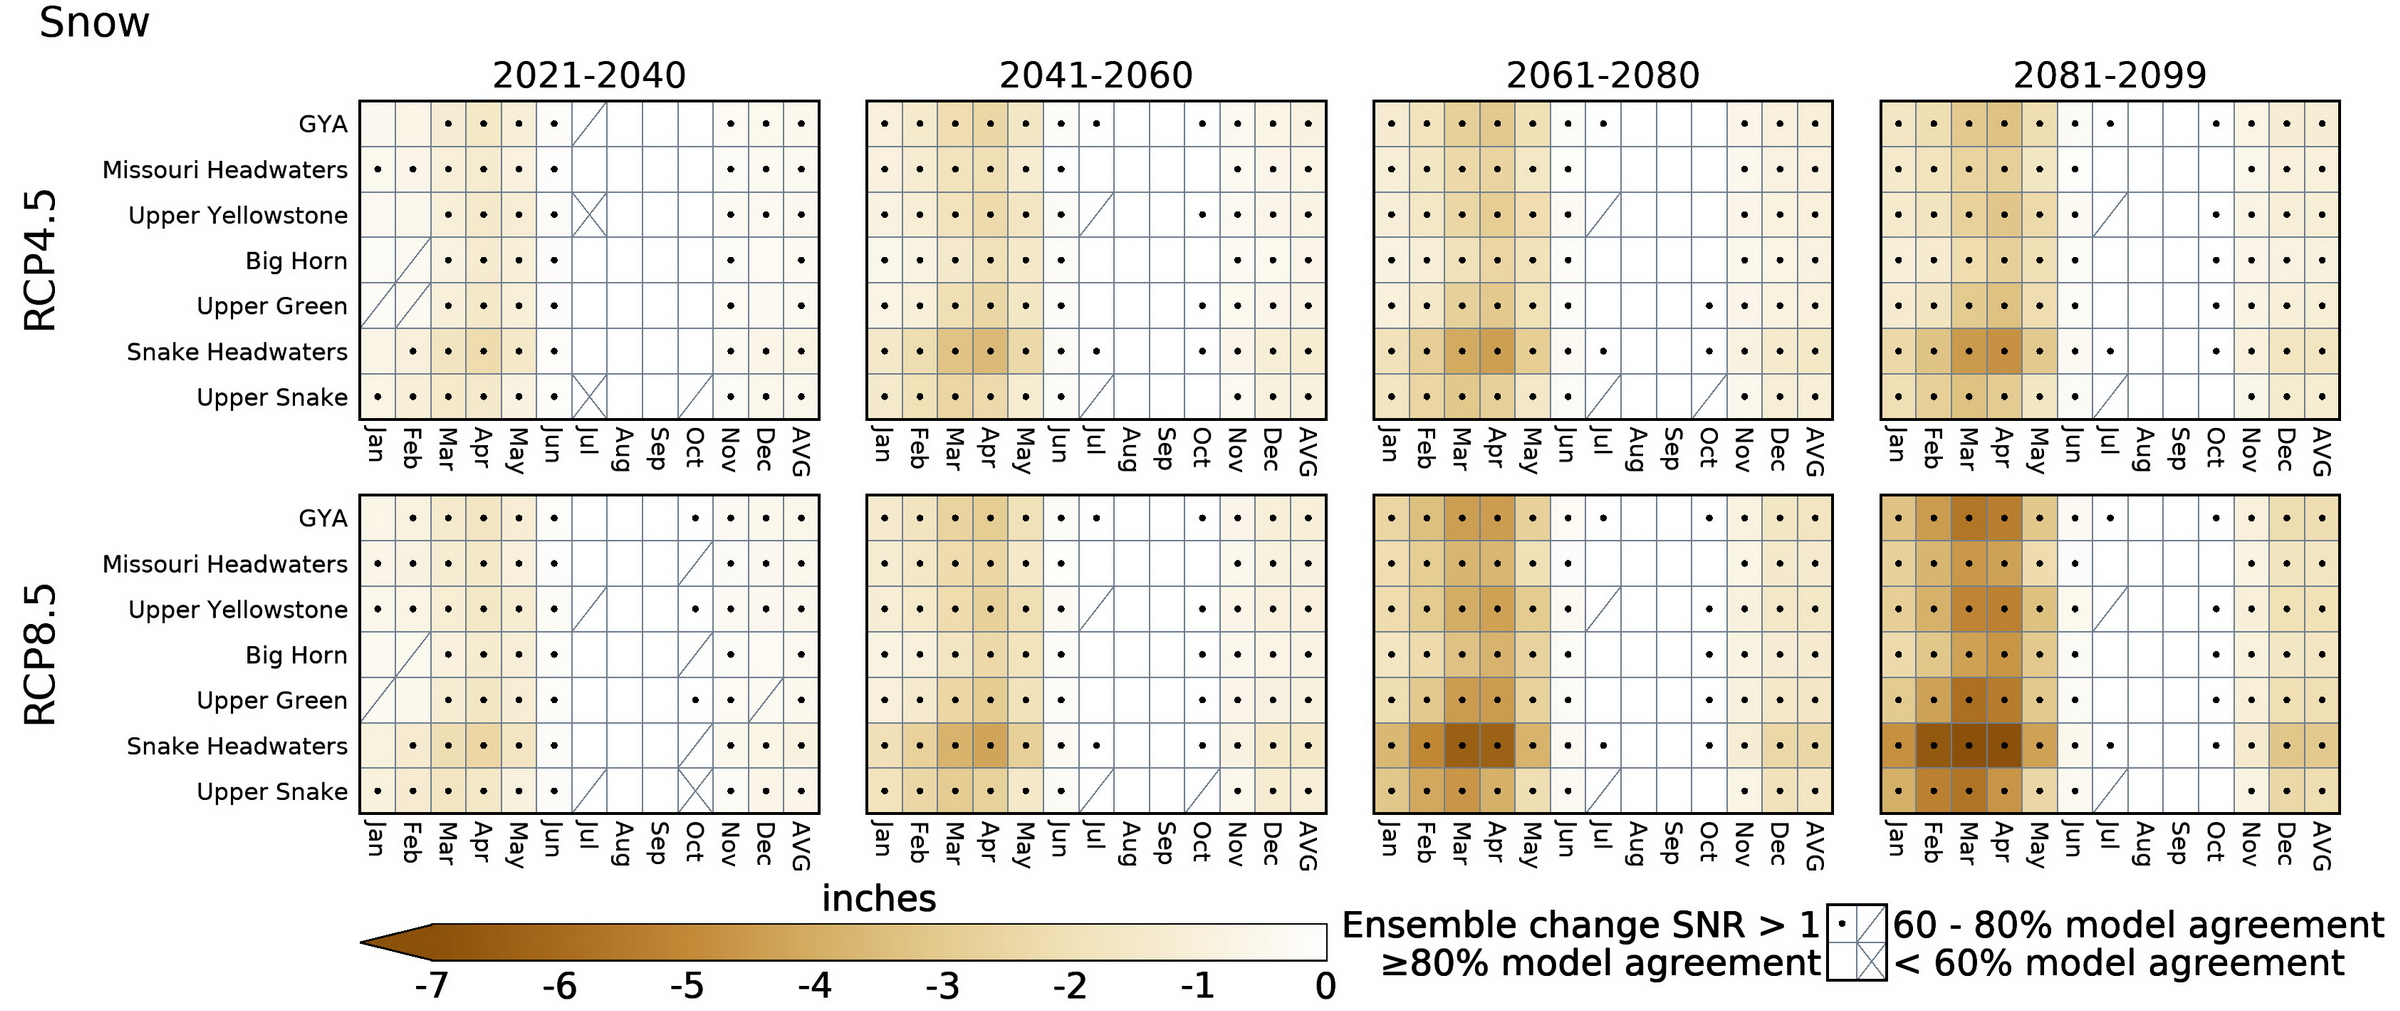
Figure 7-3. Change in the monthly and annual amount of water stored in the snowpack (snow water equivalent) over the Hydrologic Unit Code 6 (HUC6) watersheds and Greater Yellowstone Area (GYA), as simulated by the water balance model. The columns from left to right show changes for each future period (e.g., 2021-2040) relative to the 1986-2005 base period with Representative Concentration Pathway 4.5 (RCP4.5) on the top row and RCP8.5 on the bottom row. In each RCP figure, the months and annual mean (AVG) run from left to right across the horizontal axis on the bottom and the HUC6 watersheds and GYA run along the vertical axis on the left. Colored cells indicate >80% (more than 16 of the 20 models) agree on the sign of the change in the median value (positive or negative). A slash in a colored cell indicates that 60-80% of the models (12-16 out of 20) agree on the sign of the change, and an X in a box indicates that fewer than 60% (<12) of the models agree on the sign of the change. A black dot in a box indicates that the ensemble mean value of the future change is greater than the inter-model standard deviation (SNR >1), an indicator of significance of the change (see Chapter 1 for details). Shown are the 20 model means of the simulations that used the MACAv2-METDATA data as model input.
Beginning in the 2021-2040 period, there is a high level of model agreement with SNRs >1 in the loss of snowpack (SWE) in all the HUC6 watersheds. The greatest absolute losses are in the Snake Headwaters, which receives most of its precipitation from Pacific storms during the cold season. By 2041-2060, the monthly loss of snowpack is unidirectional and evident in all HUC6 watersheds, in all future periods, and under both RCPs. There is greater than 95% model agreement (19 to 20 out of 20 models) and SNRs >1 for the GYA and HUC6 watersheds from November through May when snowpack is present.
Runoff
Runoff considered by elevation
As simulated by the water balance model, over the 1986-2005 base period the source of runoff in the GYA primarily originates from snowmelt at elevations between 6000 and 10,000 ft (1800 and 3000 m), where snowpack accumulates (left column, Figure 7-4). Sixty three percent of annual precipitation over the GYA becomes runoff and in some areas of the GYA up to 80% of annual runoff is supplied by snowmelt. Runoff begins at lower- and mid-elevations in March and April and generally peaks in May or June in the HUC6 watersheds (left column, Figure 7-5).
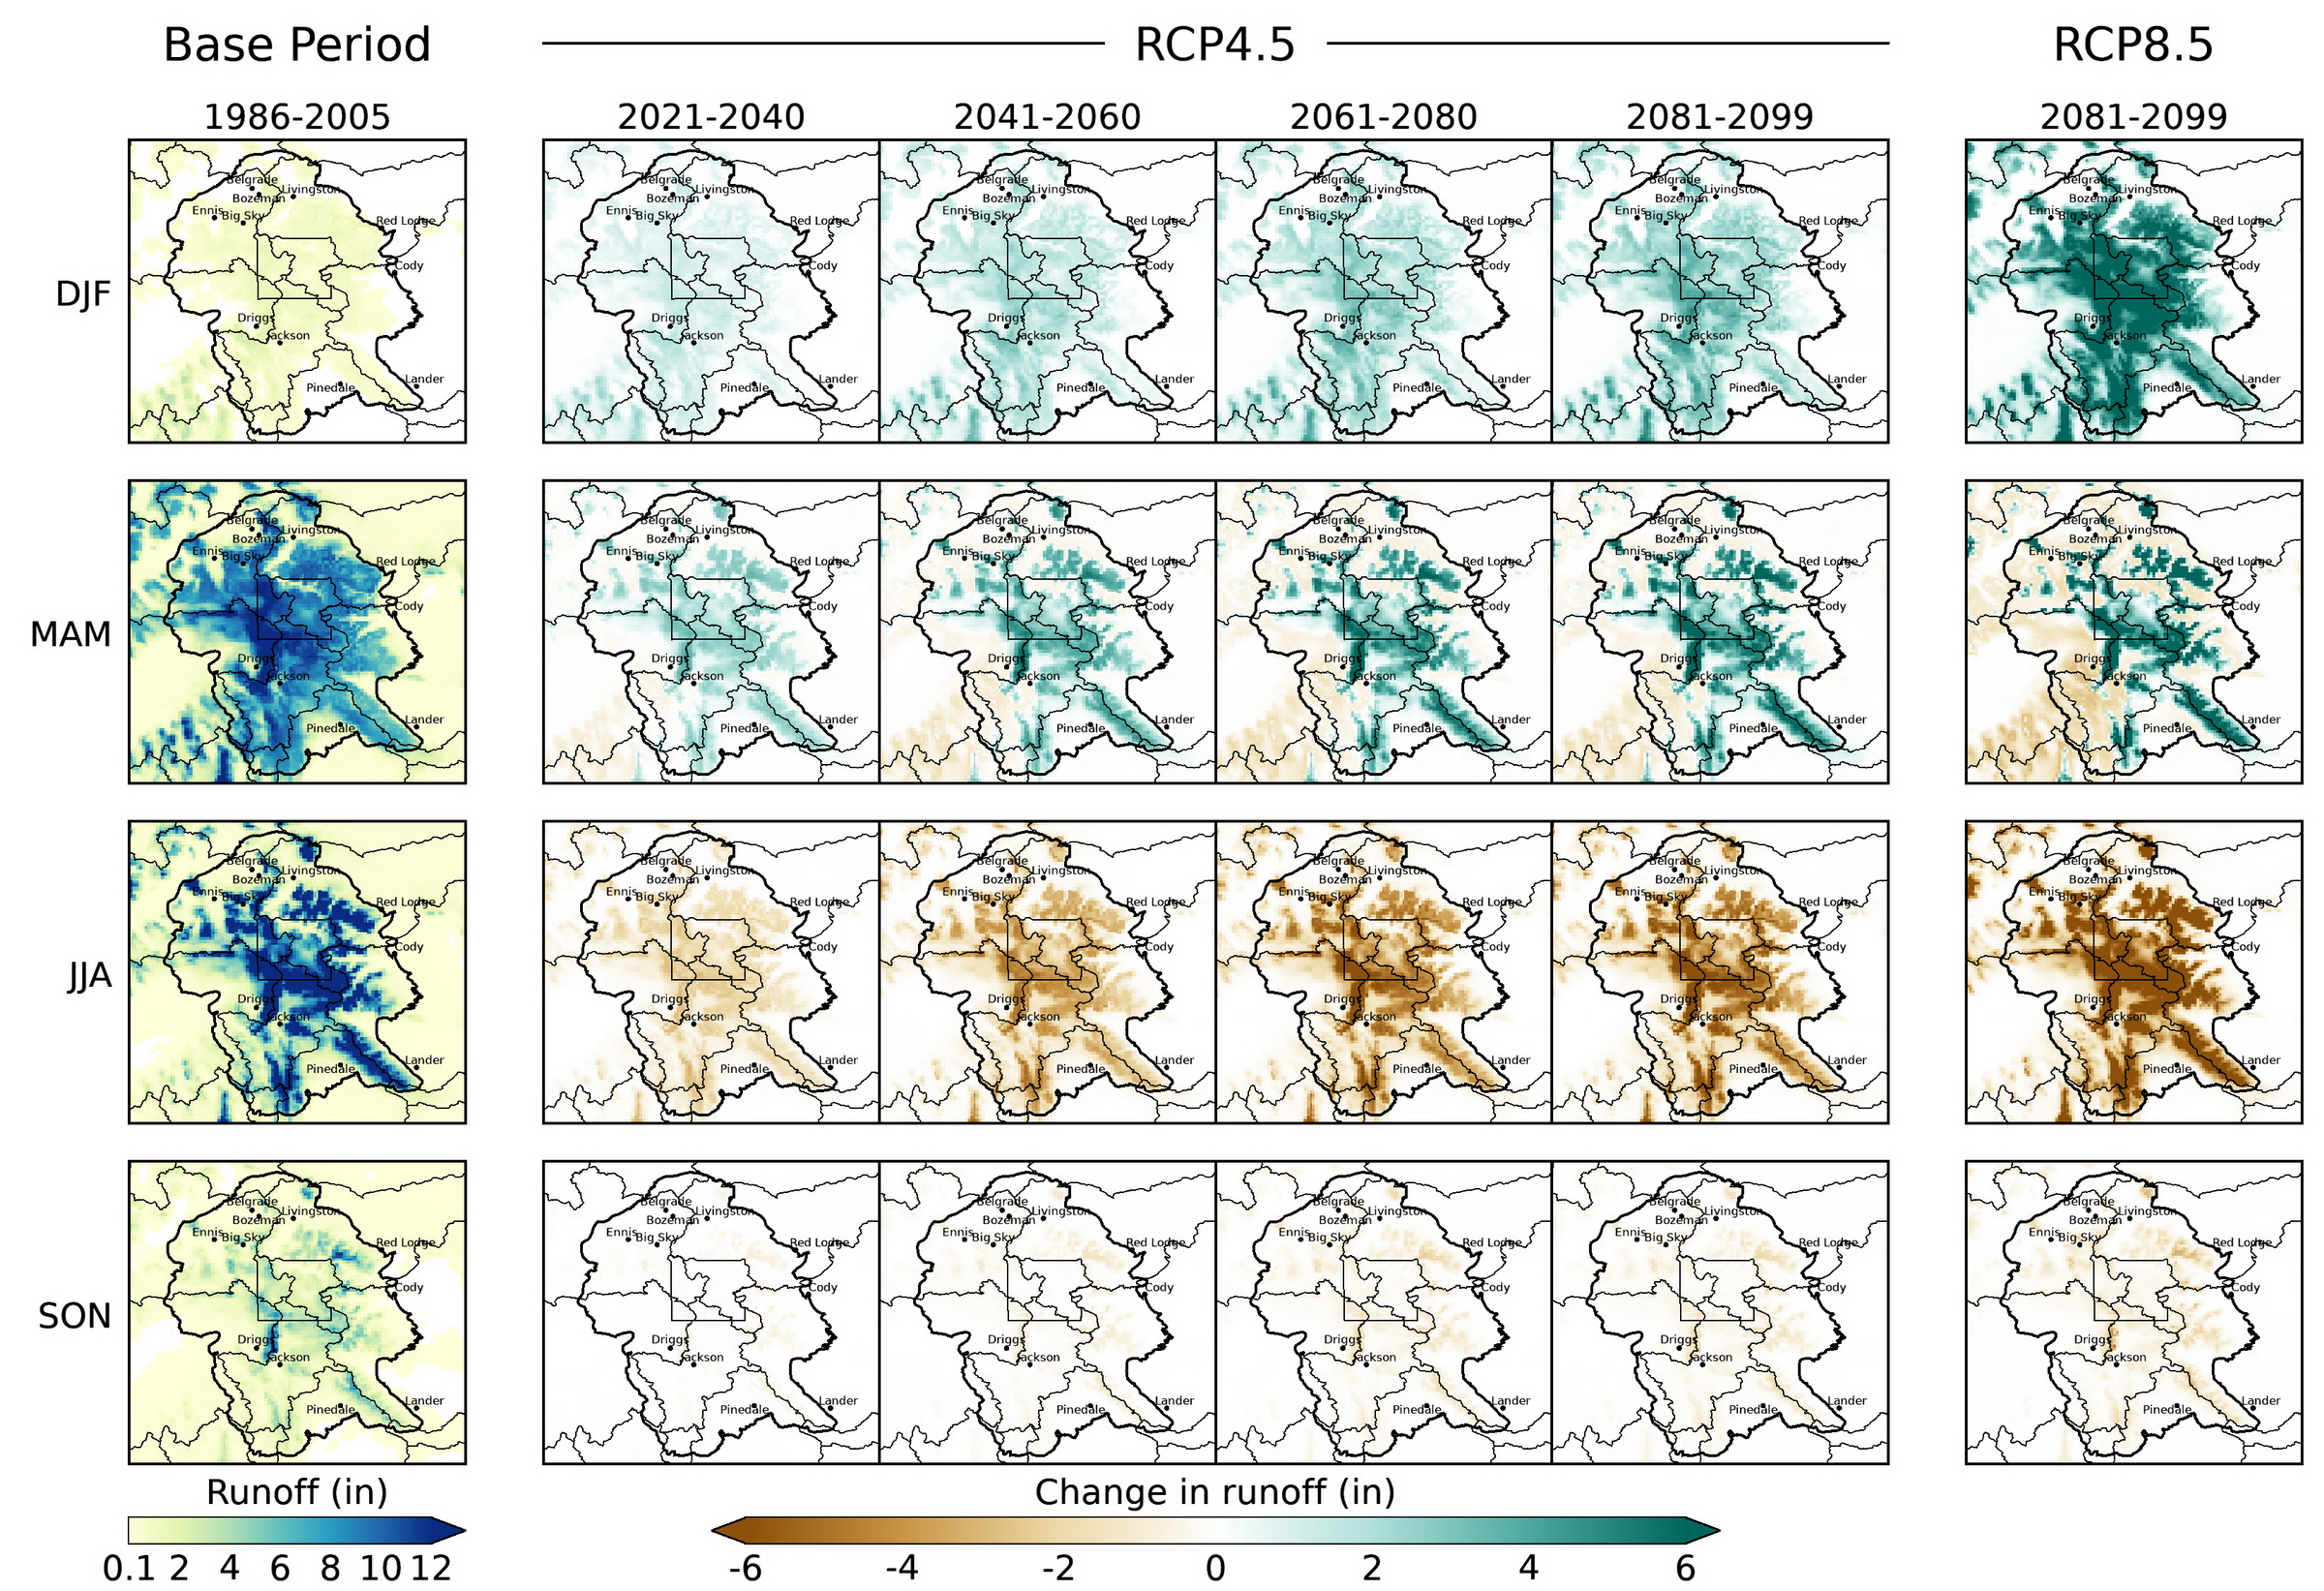
Figure 7-4. Seasonal mean runoff in the Greater Yellowstone Area for the 1986-2005 base period (left column), changes under Representative Concentration Pathway 4.5 (RCP4.5, four center columns), and changes at the end of the 21st century under RCP8.5 (right column), as simulated by the water balance model. The seasons (e.g., December-February [DJF]) are arranged in rows and the changes relative to the 1986-2005 base period for each future period (e.g., 2021-2040) are in columns. Shown are the 20-model means of the simulations that used MACAv2-METDATA data as model input. See Figure A7-4 for RCP8.5.
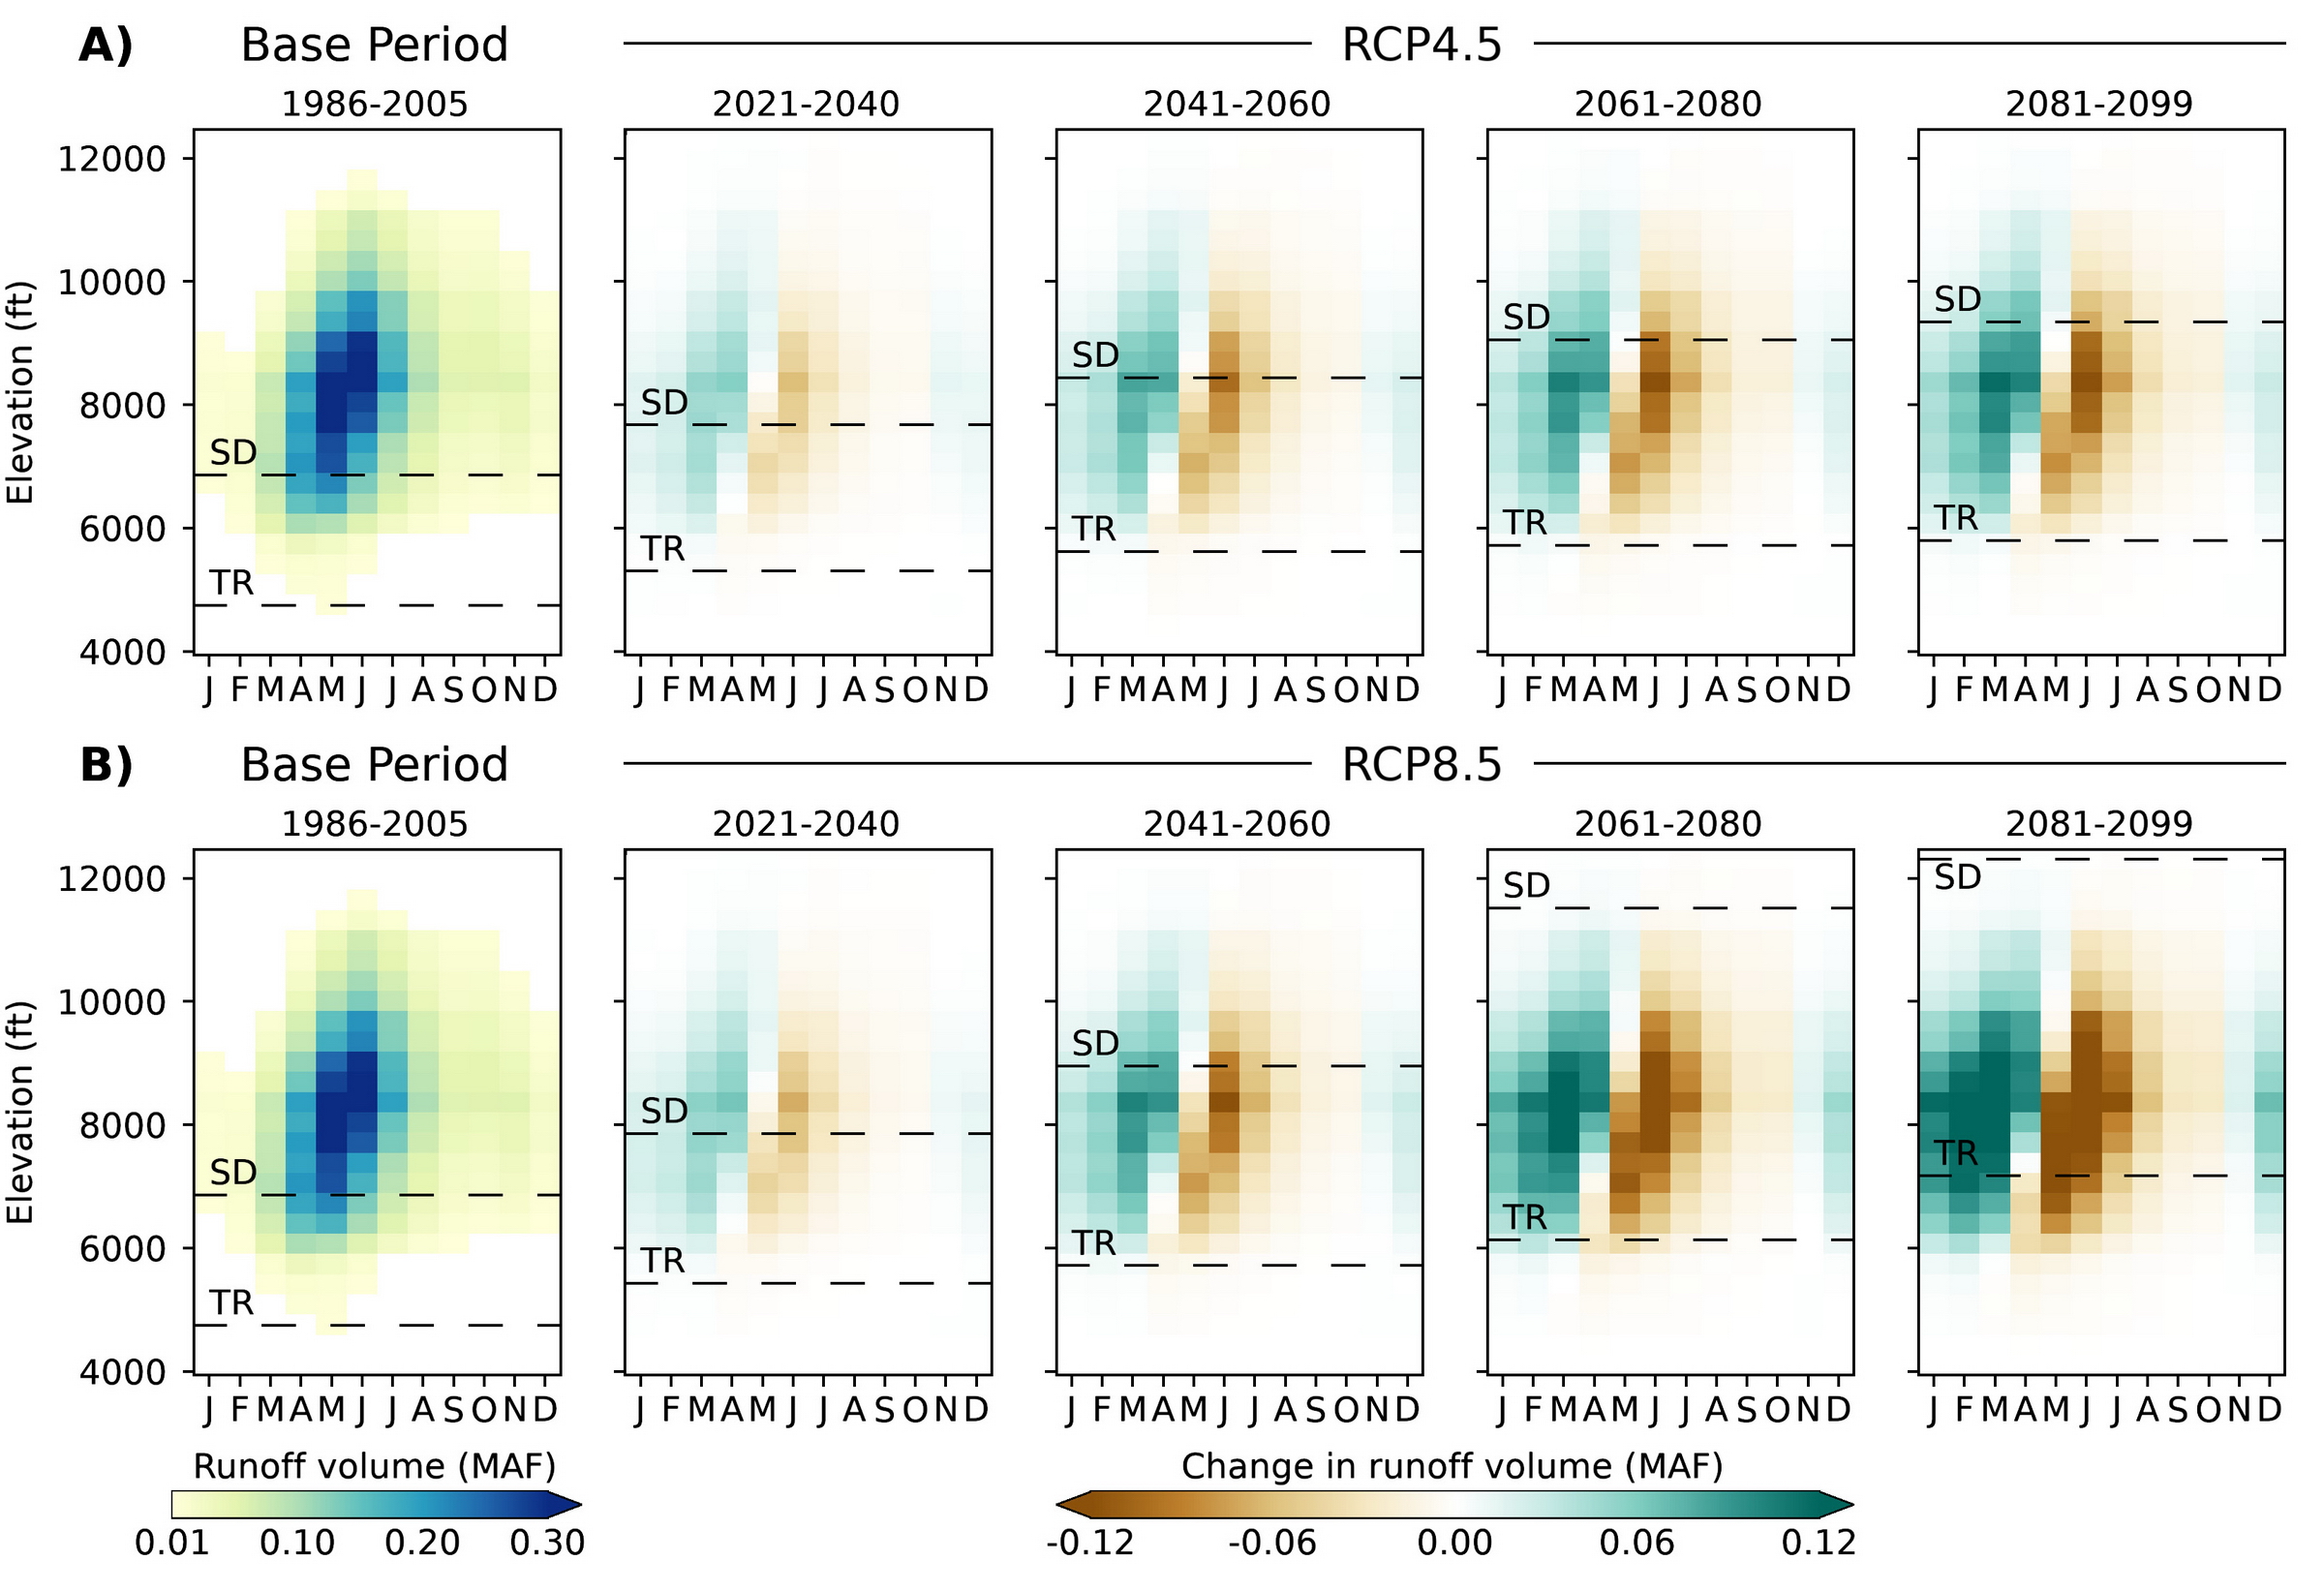
Figure 7-5. Mean monthly runoff by elevation in the Greater Yellowstone Area for the base period and changes under A) Representative Concentration Pathway 4.5 (RCP4.5) and B) RCP8.5, as simulated by the water balance model. The units are millions of acre-ft (MAF). The raw value for 1986-2005 base period is plotted in the left column and the projected changes for the indicated future periods are plotted in the panels to the right. In each period plot the dashed line labeled “TR” is the lower elevational limit of the zone of rain-snow mixed precipitation; below the TR line precipitation is all rain. The upper dashed line labeled “SD” is the lower elevational limit of the snow dominated zone. See Figure 7-1 for more information. Shown are the 20-model means of the simulations that used MACAv2-METDATA data as model input. See Figure A7-4 for RCP8.5.
Under both RCP4.5 and RCP8.5, the onset of runoff is projected to shift progressively earlier in the year (Figures 7-4, 7-5, and A7-2). As a result, there is more runoff than present in February through April and less from May through August. Earlier runoff originates from earlier snowmelt and more immediate runoff of rain, the latter because warmer temperatures increase the portion of precipitation falling as rain instead of snow. The contribution of snowmelt to runoff is reduced by 5-25% by the end of century, in agreement with Li et al. (2017).
The potential for future changes in major flooding from rain‑on‑snow events varies across the GYA (Mussleman et al. 2018). Historically, such events occur on average up to 3 days/yr during spring. The events tend to originate from mid-elevations where snowpack melts under unusually heavy rainfall when the elevation of the freezing level rises rapidly. Progressive loss of snowpack at low and mid-elevations will likely reduce rain-on-snow events at elevations where they now occur; however, as the susceptible range of snow rises to higher elevations under warming, the number of events could increase by an additional day or two in the future (Mussleman et al. 2018). Queen et al. (2021) found that warming and a shift to more rain-dominated precipitation will likely extend the flood season on the Upper Snake River around Jackson WY (presently from mid-May to mid‑June), to earlier in the year and increase the magnitude of large floods (10-year and 100-year recurrence interval).
The seasonal cycle of runoff in the HUC6 watersheds
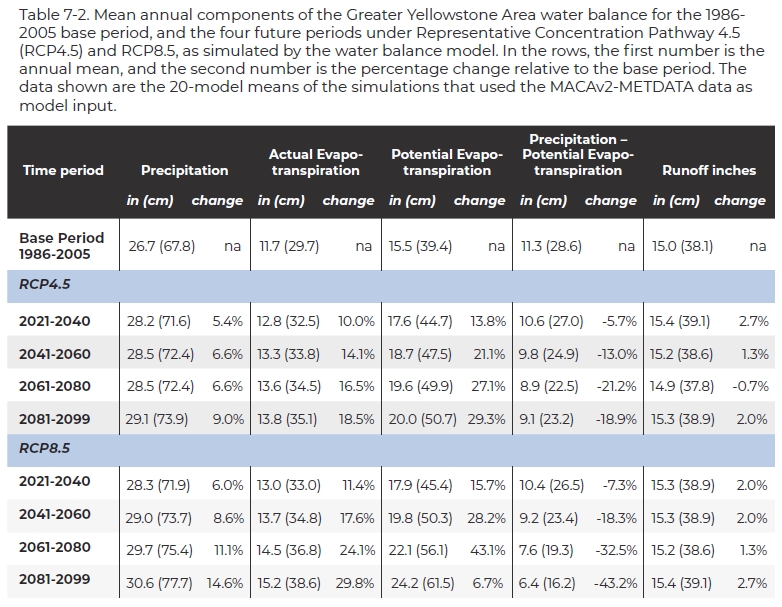
Precipitation is projected to increase somewhat over the 21st century under both RCPs; however, modeled increases in evapotranspiration offset the additional precipitation and reduce total annual runoff (Table 7-2). Based on the precipitation and runoff numbers in Table 7-2, 56% of annual precipitation becomes runoff during the 1986-2005 base period. That percentage decreases as both precipitation and evapotranspiration increase through the 21st century and by 2081-2099 is reduced to 53% under RCP4.5 and 51% under RCP8.5.
Annual hydrographs illustrate how projected monthly runoff from the HUC6 basins changes relative to the 1986-2005 base period (Figure 7-6). For the 1986-2005 base period, modeled runoff peaks during June in the Upper Yellowstone and Big Horn HUC6 watersheds and during May in the other watersheds. Beginning with the 2021-2040 period, under RCP4.5 the timing of peak runoff in the Upper Yellowstone and Big Horn watersheds shifts from June to May. In all watersheds the magnitudes of May runoff peaks decline progressively, January through April runoff increases, and June through October runoff decreases.
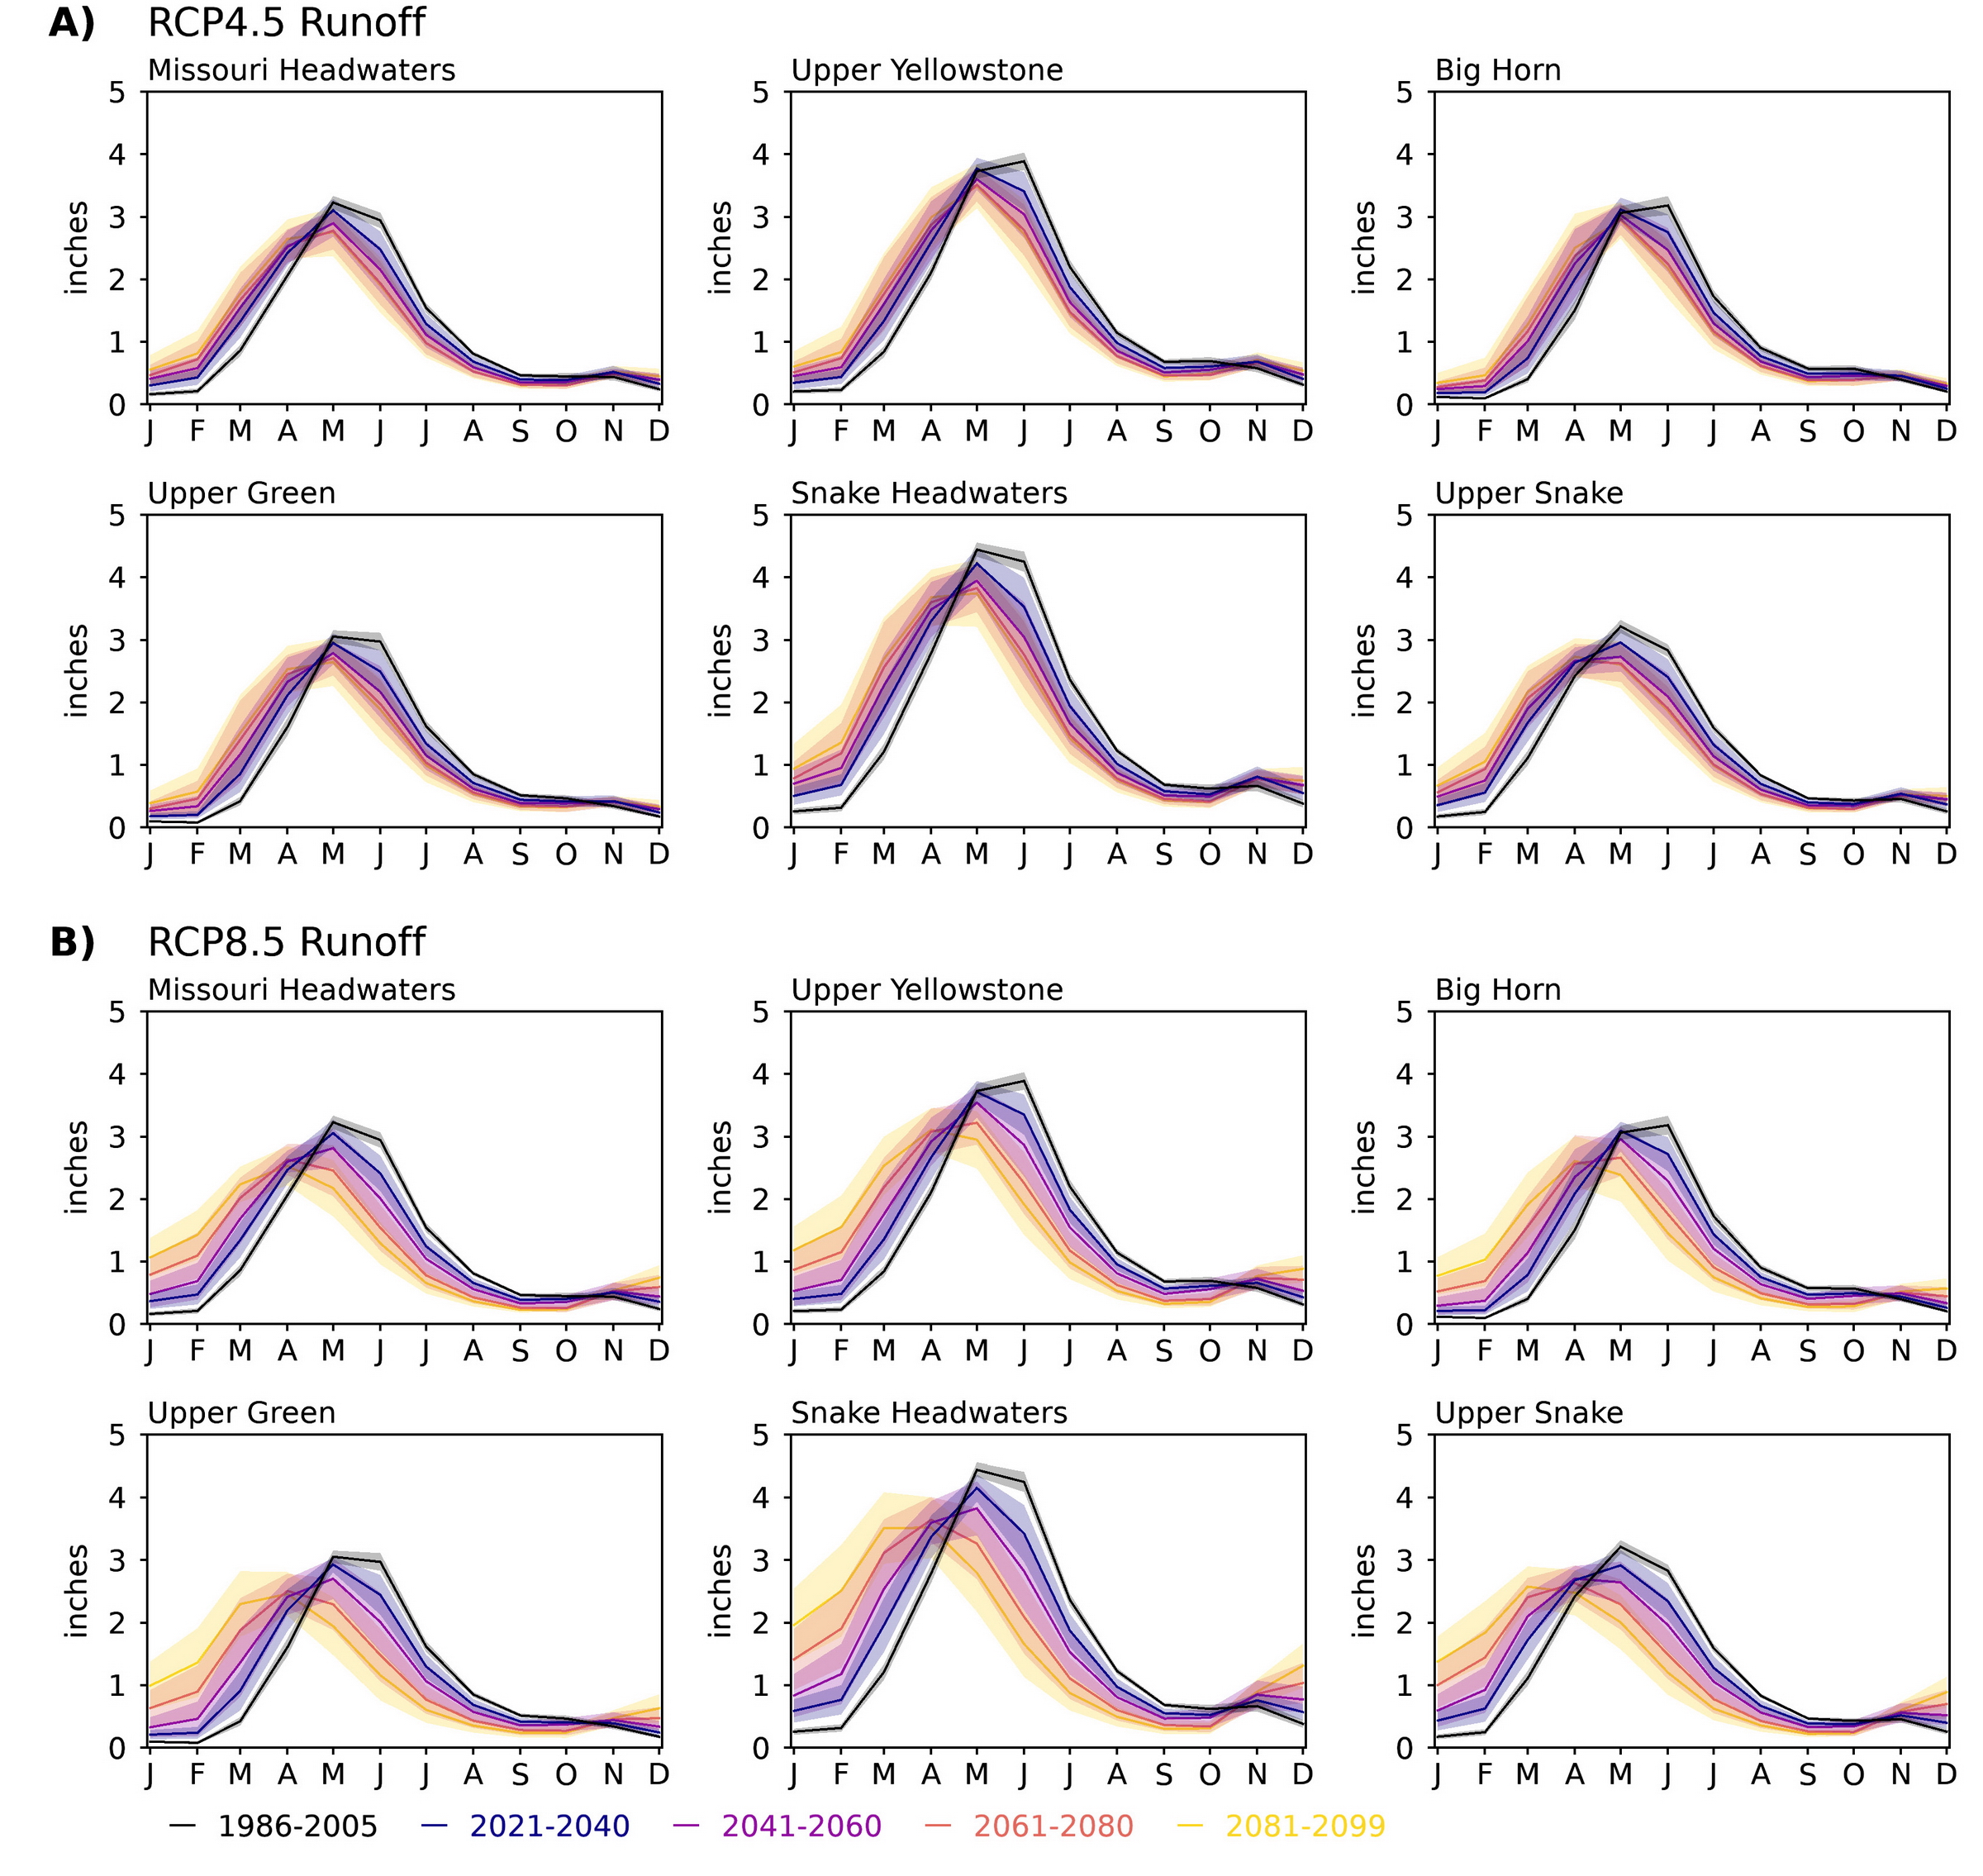
Figure 7-6. Seasonal cycle of mean monthly runoff for the Hydrologic Unit Code 6 (HUC6) watersheds under Representative Concentration Pathway 4.5 (RCP4.5) and RCP8.5, as simulated by the water balance model. The black line shows 1986-2005 base period. The colored lines are the 20-model means of the simulations that used MACAv2-METDATA data as model input for the periods indicated in the legend at the bottom. The shaded bands are the model spread around the respective colored mean lines.
Runoff changes are more striking under RCP8.5 and, except for the Upper Yellowstone and Big Horn watersheds, by the 2061-2080 period peak runoff shifts from May to April. At the end of century peak runoff shifts to March in the southwestern Snake Headwaters and Upper Snake watersheds. Projected summer runoff remains below that of the base period under both RCPs; thus, lower minimum streamflows occur earlier in the year in combination with projected warmer air and likely warmer water temperatures.
Checkerboard plots provide an additional perspective of the changes in projected runoff, model agreement, and the statistical significance of the changes over GYA and HUC6 watersheds (Figure 7-7). As in the checkerboard plots in previous chapters, each rectangular grid in Figure 6-5 illustrates the differences (anomalies) between a given period and the base period (e.g., 2021-2040 minus 1986-2005) broken down by monthly and annual means, for the GYA and each HUC6 watershed.
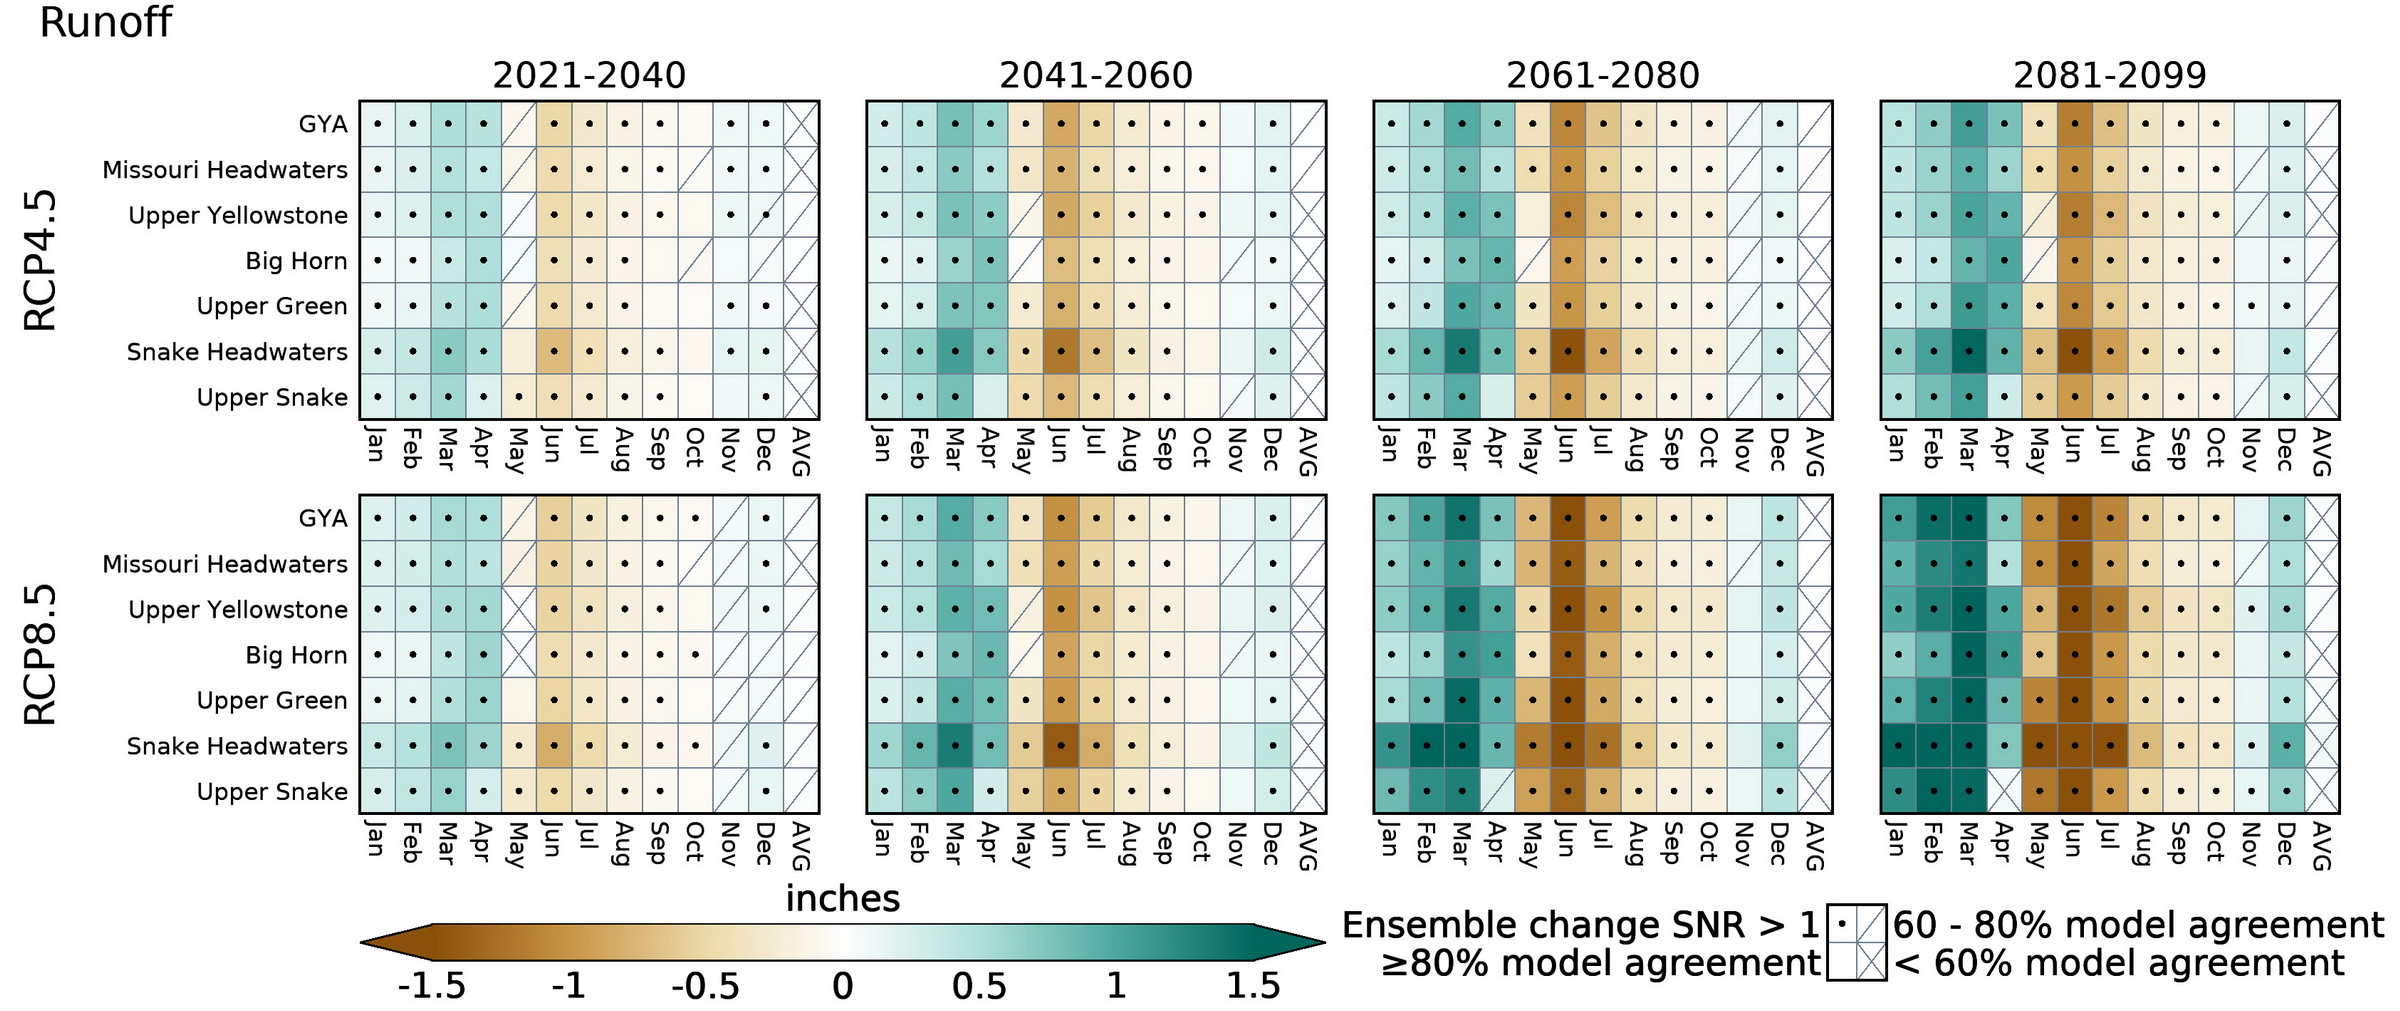
Figure 7-7. Change in mean monthly and annual runoff over the Hydrologic Unit Code 6 (HUC6) watersheds and the Greater Yellowstone Area (GYA), as simulated by the water balance model. The columns from left to right show changes for each future period (e.g., 2021-2040) relative to the 1986-2005 base period with Representative Concentration Pathway 4.5 (RCP4.5) on the top row and RCP8.5 on the bottom row. In each RCP figure, the monthly and annual means (AVG) run from left to right across the horizontal axis on the bottom and the HUC6 watersheds and GYA run along the vertical axis on the left. Colored cells indicate >80% (more than 16 of the 20 models) agree on the sign of the change in the median value (positive or negative). A slash in a colored cell indicates that 60-80% of the models (12-16 out of 20) agree on the sign of the change, and an X in a box indicates that fewer than 60% (<12) of the models agree on the sign of the change. A black dot in a box indicates that the ensemble mean value of the future change is greater than the inter-model standard deviation (SNR >1), an indicator of significance of the change (see Chapter 1 for details). Shown are the 20-model means of the simulations that use the MACAv2-METDATA data.
The progressive shift toward increased late winter and early spring runoff and reduced summer runoff in all HUC6 watersheds is clear across the rows as the century progresses. There is increasingly high model agreement with SNRs >1. This shift is most evident in the Snake Headwaters watershed. Minimal change is projected (i.e., plot colors remain close to white) after September when projected runoff is generally similar to that of the base period.
The link between changes in the timing of snowmelt and runoff in the HUC6 watersheds (Figure 7-3) is highlighted in Figure 7-7. Except for November and December, after 2021-2040, there is high and increasing model agreement and SNRs >1 in the monthly changes over all watersheds.
Evapotranspiration and Soil Water
As discussed in Chapters 2 and 3, drought is a recurring hydrologic feature of the GYA. Like much of the western United States, with future warming drought in the GYA will likely become more frequent and severe. Predicting hydrologic drought and seasonal availability of water in snow-dominated areas will become increasingly more challenging as less precipitation falls as snow, snowpack declines, and evapotranspiration increases (Livneh and Badger 2020).
For the 1986-2005 base period, over the GYA mean annual potential evapotranspiration (15.5 inches (39.4 cm)/yr) is greater than actual evapotranspiration (11.7 inches (29.7 cm)/yr) by 3.8 inches (9.6 cm)/yr (Table 7-2). The difference indicates that in the GYA the supply of water from precipitation is insufficient to meet evapotranspiration demand during summer and fall when demand is highest. Additional water is supplied by soil moisture; however, extracting water from the soil gets increasingly more difficult as the soil dries out, both in nature and in the water balance model.
As shown by the seasonal maps for the 1986-2005 base period (left column, Figure 7-8), precipitation minus potential evapotranspiration (P-PET) is positive—that is, precipitation exceeds potential evapotranspiration—over most of the GYA during winter, spring, and fall so there is no water deficit then. Negative values of P-PET, or water deficits, emerge in late spring and persist through summer while PET exceeds P. Negative values indicate how much additional precipitation is needed to balance PET. The largest deficits occur over the lower elevations just outside GYA and in the river valleys and lower elevations within the GYA. P-PET values remain nearly balanced (P equals PET) or slightly positive at higher elevations.
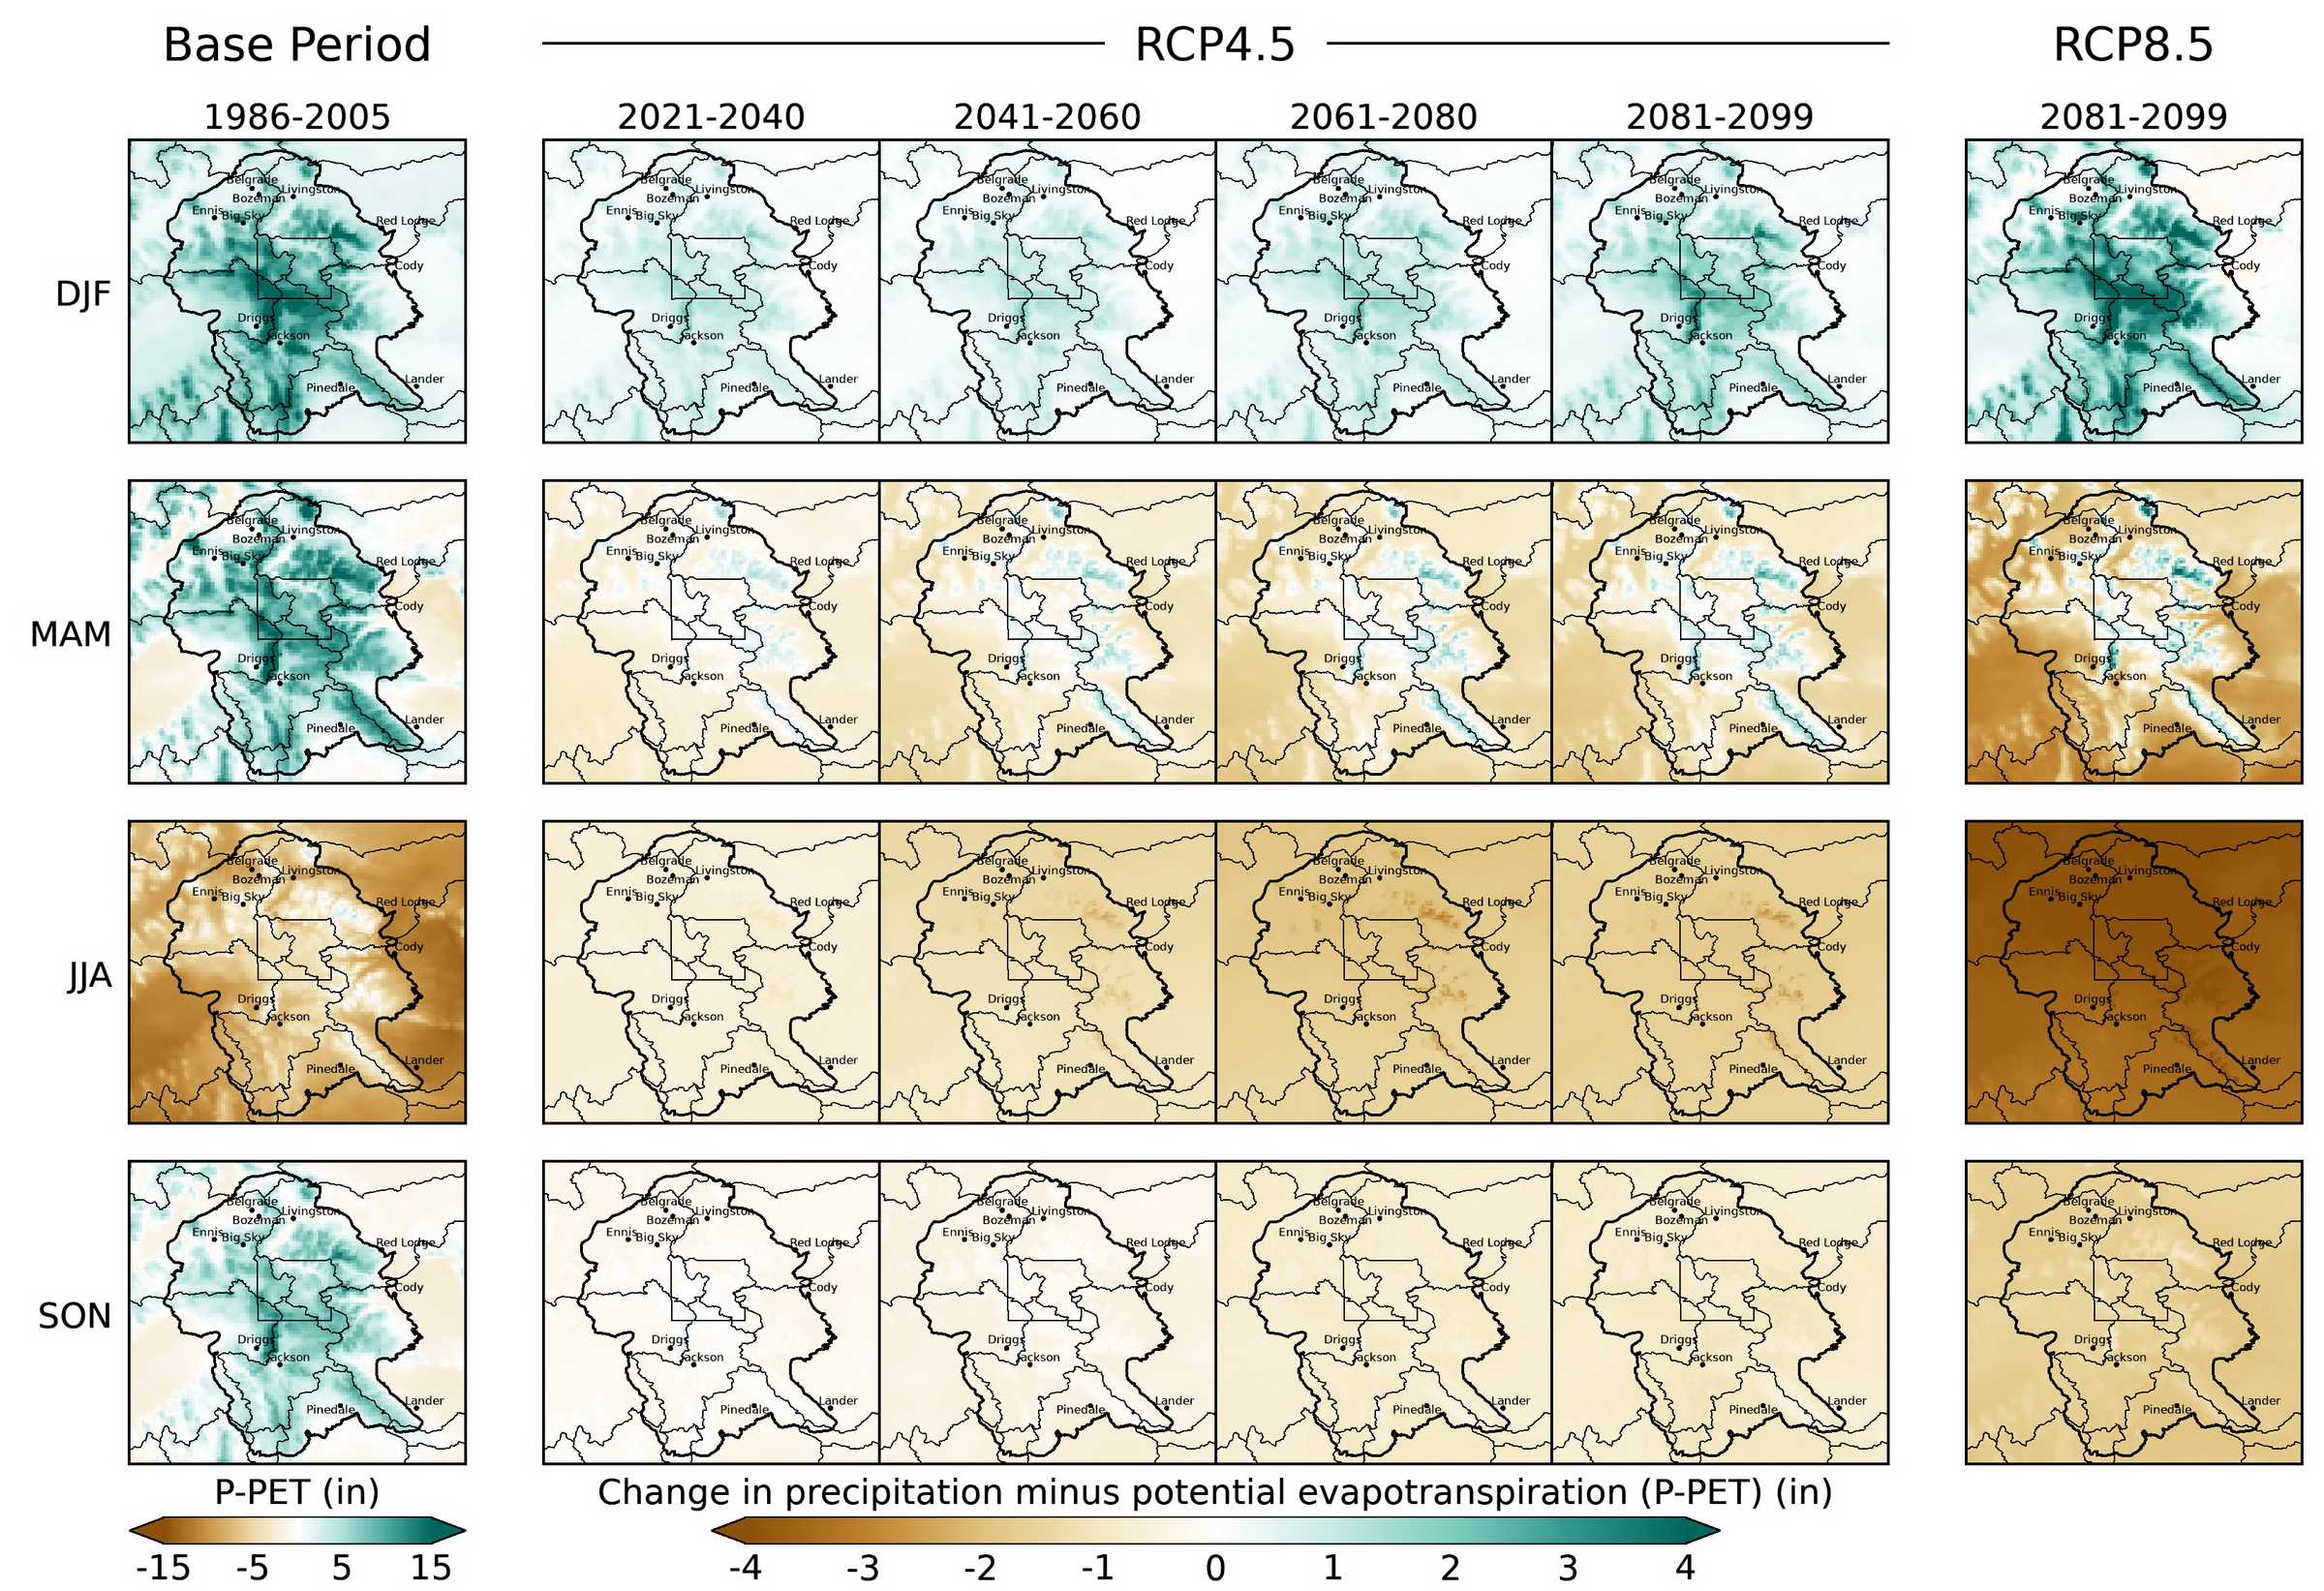
Figure 7-8. Seasonal mean precipitation minus potential evapotranspiration (P-PET) in the Greater Yellowstone Area for the 1986-2005 base period (left column), changes under Representative Concentration Pathway 4.5 (RCP4.5, four center columns), and changes at the end of the 21st century under RCP8.5 (right column), as simulated by the water balance model. The seasons (e.g., December-February [DJF]) are arranged in rows and the changes relative to the 1986-2005 base period for each future period (e.g., 2021-2040) are in columns. Shown are the 20-model means of the simulations that used MACAv2-METDATA data as model input. See Figure A7.3 for RCP8.5.
Winter P-PET under RCP4.5 is slightly greater (by about 2%) than winter P-PET of the 1986-2005 base period throughout the 21st century (Figure 7-8) due to increasing precipitation (Figure 6-1). Increasing PET during spring and summer, coupled with little or no change in precipitation, offset winter increases, resulting in progressively lower annual total P-PET values (Table 7-2). GYA-wide, P-PET decreases by 13% annually during the 2021-2040 period and by 19% at the end of century (2080-2099, Table 7-2). Under RCP8.5, annual P-PET is reduced by 18% during the 2041-2060 (Figure A7-3) and by 30% at the end of century (Table 7-2).
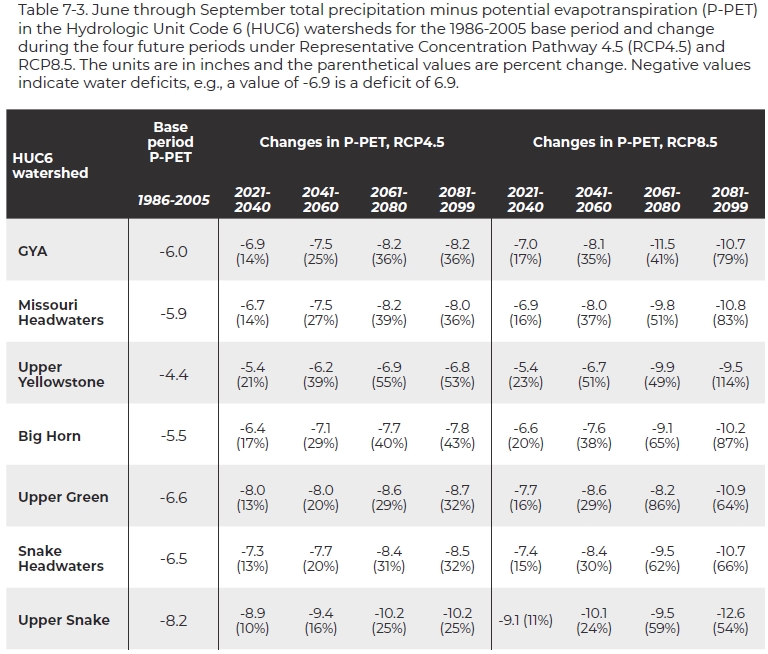
Like much of the West, the seasonal cycle of P-PET over the HUC6 watersheds is characterized by positive values from October through May and negative values (water deficits) from June through September; July is the most negative month (Figure 7-9). Total annual P-PET for the 1986-2005 base period ranges from 8 inches (20 cm) in the Upper Green to 16 inches (40 cm) in the Snake Headwaters watersheds. Summer (June through September total) deficits for the 1986-2005 base period range from 4 inches (10 cm) in the Upper Yellowstone to 8 inches (20 cm) in the Upper Snake watersheds (Table 7-3). Under both RCPs, through the 21st century summer deficits increase (Table 7-3). Under RCP4.5, by mid century (2041‑2060) the increased deficits range from 16% in the Upper Snake to 39% in the Upper Yellowstone watersheds. By the end of the century (2081-2099), deficit increases range from 25% to 53% in those watersheds. Under RCP8.5, deficits increase from 24% in the Upper Snake to 51% in the Upper Yellowstone by mid century and from 54% to 114% in those watersheds by the end of the century.
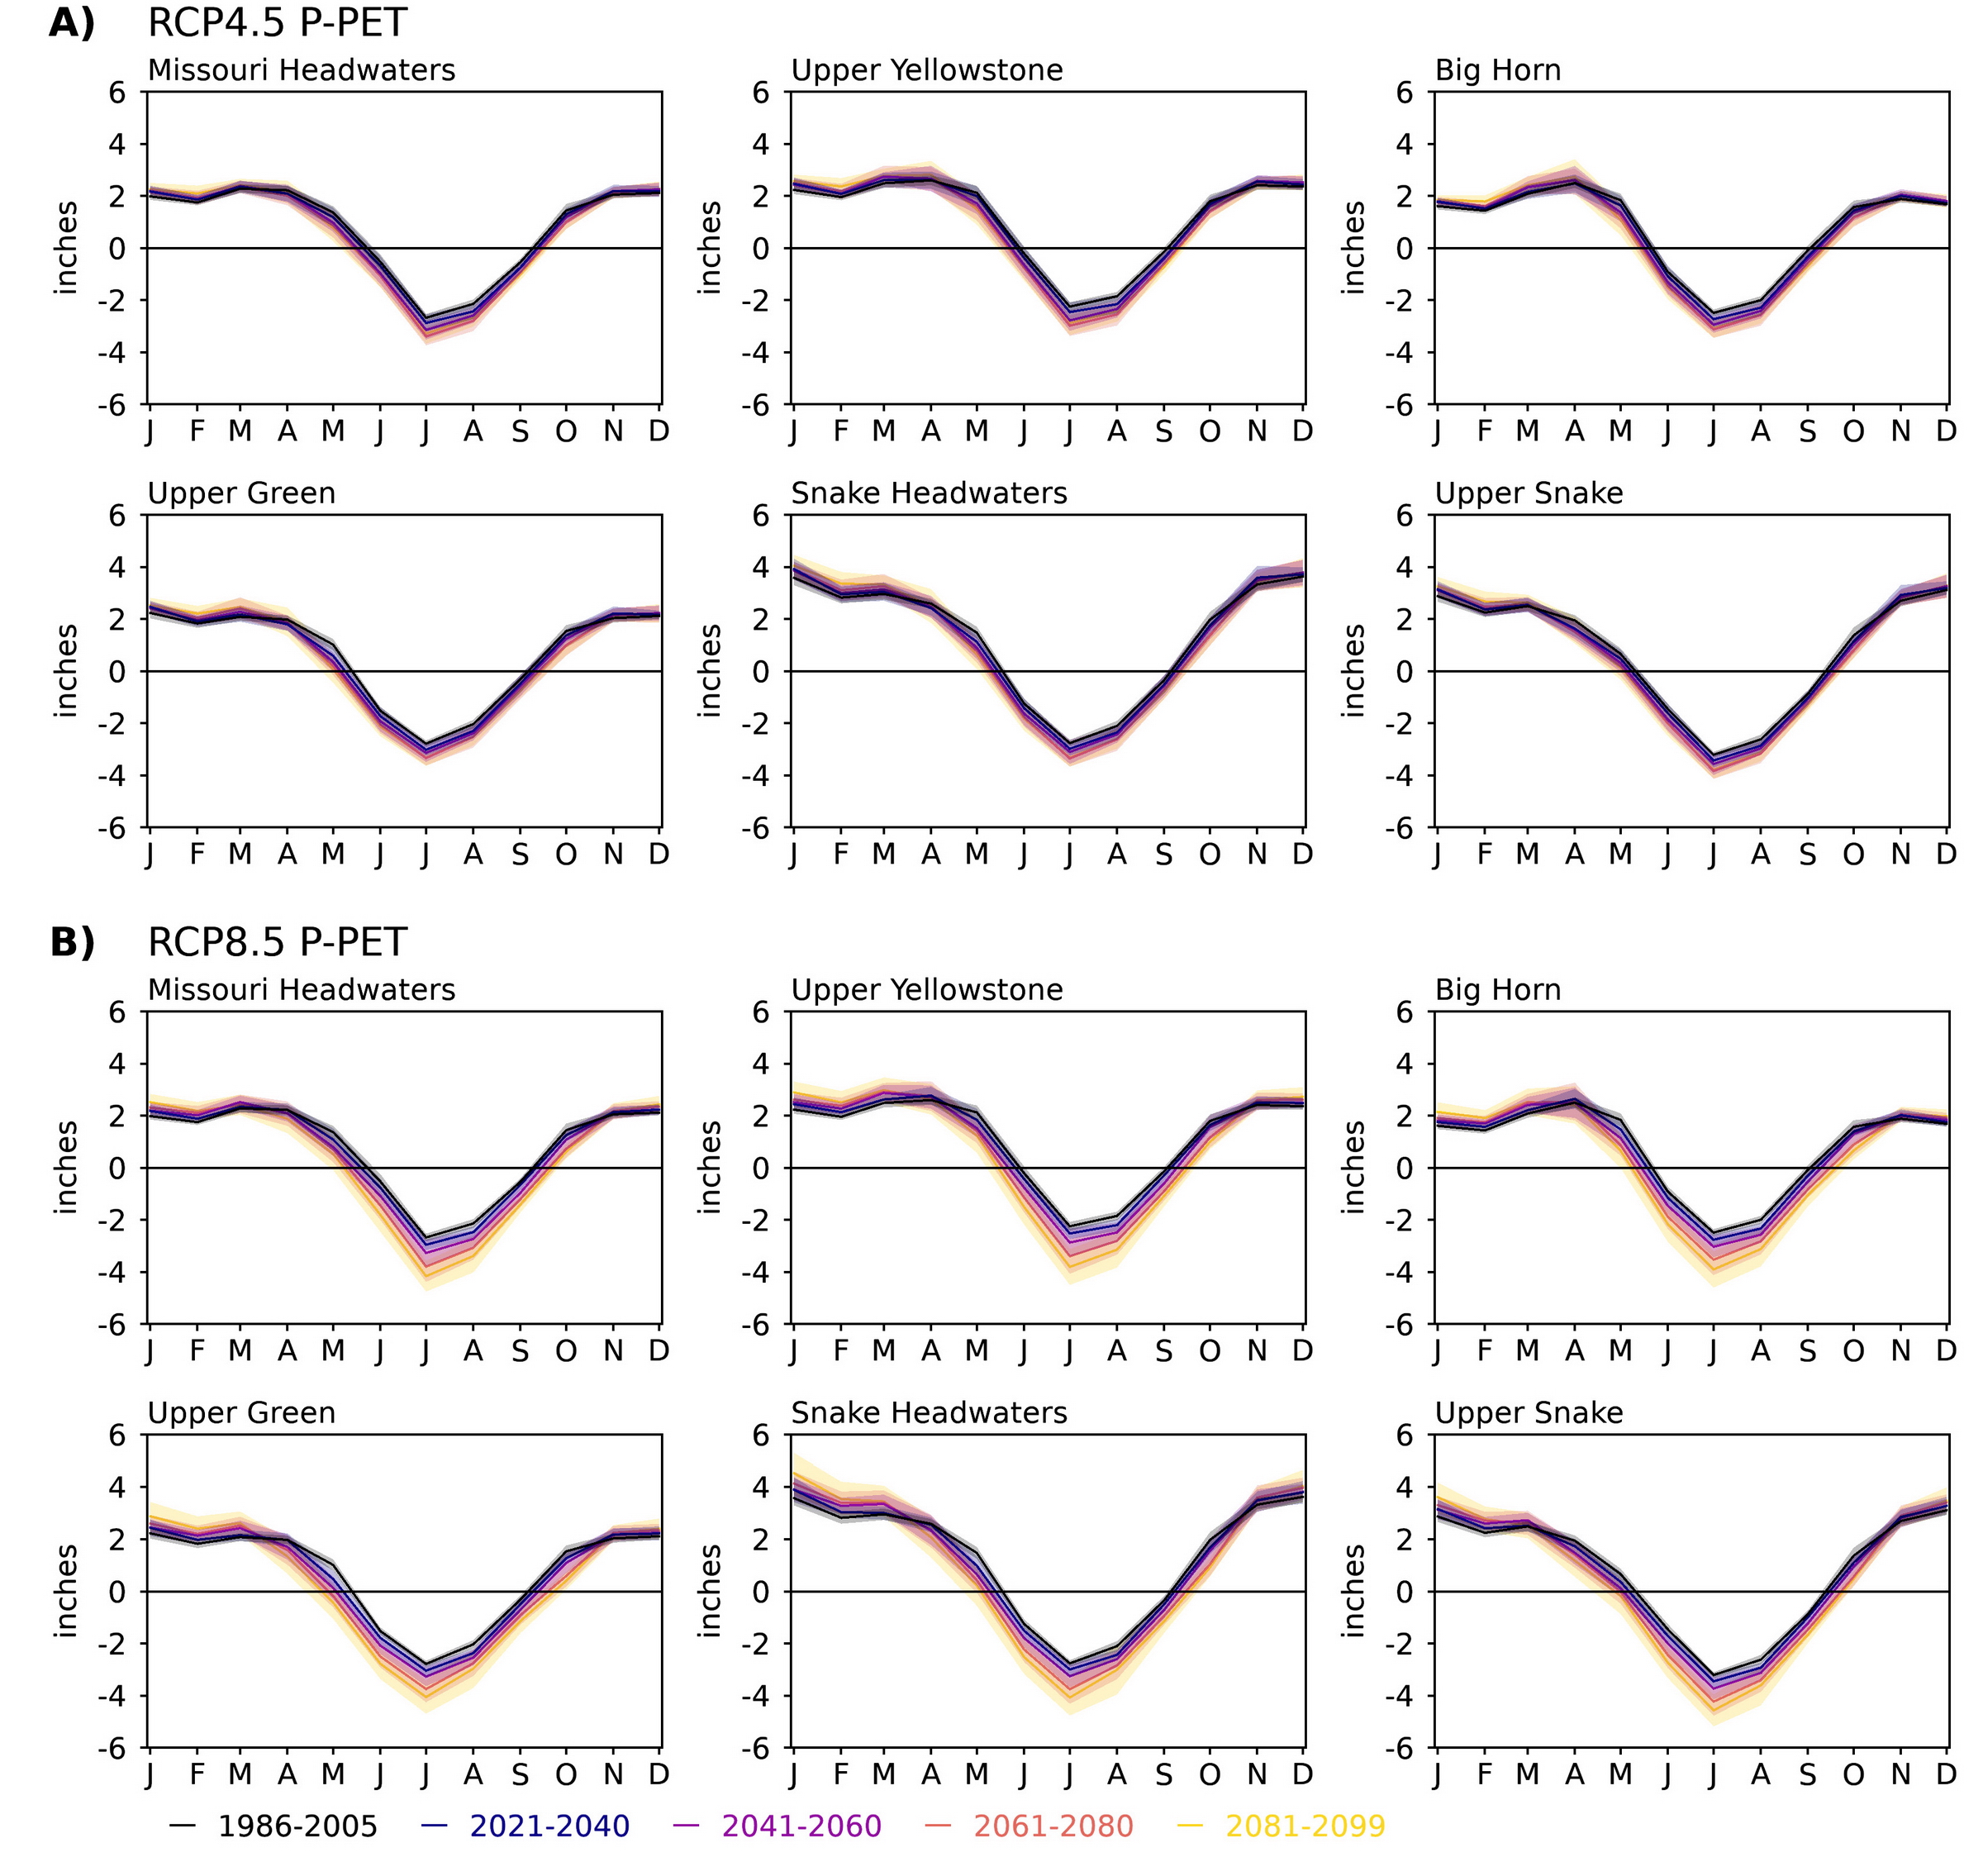
Figure 7-9. The seasonal cycle of mean monthly precipitation minus potential evapotranspiration (P-PET) for the Hydrologic Unit Code 6 (HUC6) watersheds under Representative Concentration Pathway 4.5 (RCP4.5) and RCP8.5, as simulated by the water balance model. The black line is shows 1986-2005 base period. The colored lines are the 20-model means of the simulations that used MACAv2-METDATA data as model input for the periods indicated in the legend at the bottom. The shaded bands are the model spread around the respective colored mean lines.
Note that the graphs in Figure 7-9 are means over the HUCs and summer P-PET over lower elevation agricultural areas can be more negative than the HUC-wide mean depending on location, soils, and use (e.g., alfalfa or pasture). Conversely, at higher elevations, P‑PET is less negative to slightly positive (Figure 7-8).
In response to the seasonal cycle of P-PET, soil moisture is recharged during months when P exceeds PET and is depleted during months when PET exceeds P (Figure 7-10). The most negative P-PET occurs in July and minimum soil moisture levels occur in August. Much of the GYA is at or near 100% capacity during spring (MAM, 1986-2005 base period, left column, Figure 7-10), so precipitation and snowmelt become runoff. During summer (JJA) and fall (SON), soil moisture levels fall to about 25% in river basins at lower elevations and remain at 50% and higher over high elevations, reflecting higher precipitation and lower PET there. Beginning in the 2021‑2040 period, soil moisture levels are progressively depleted through the century in the lower elevation river basins during spring. Summer and fall soil moisture are progressively lower throughout the GYA, with the largest changes at high elevations where base period moisture levels are higher. These changes are greater under RCP8.5.
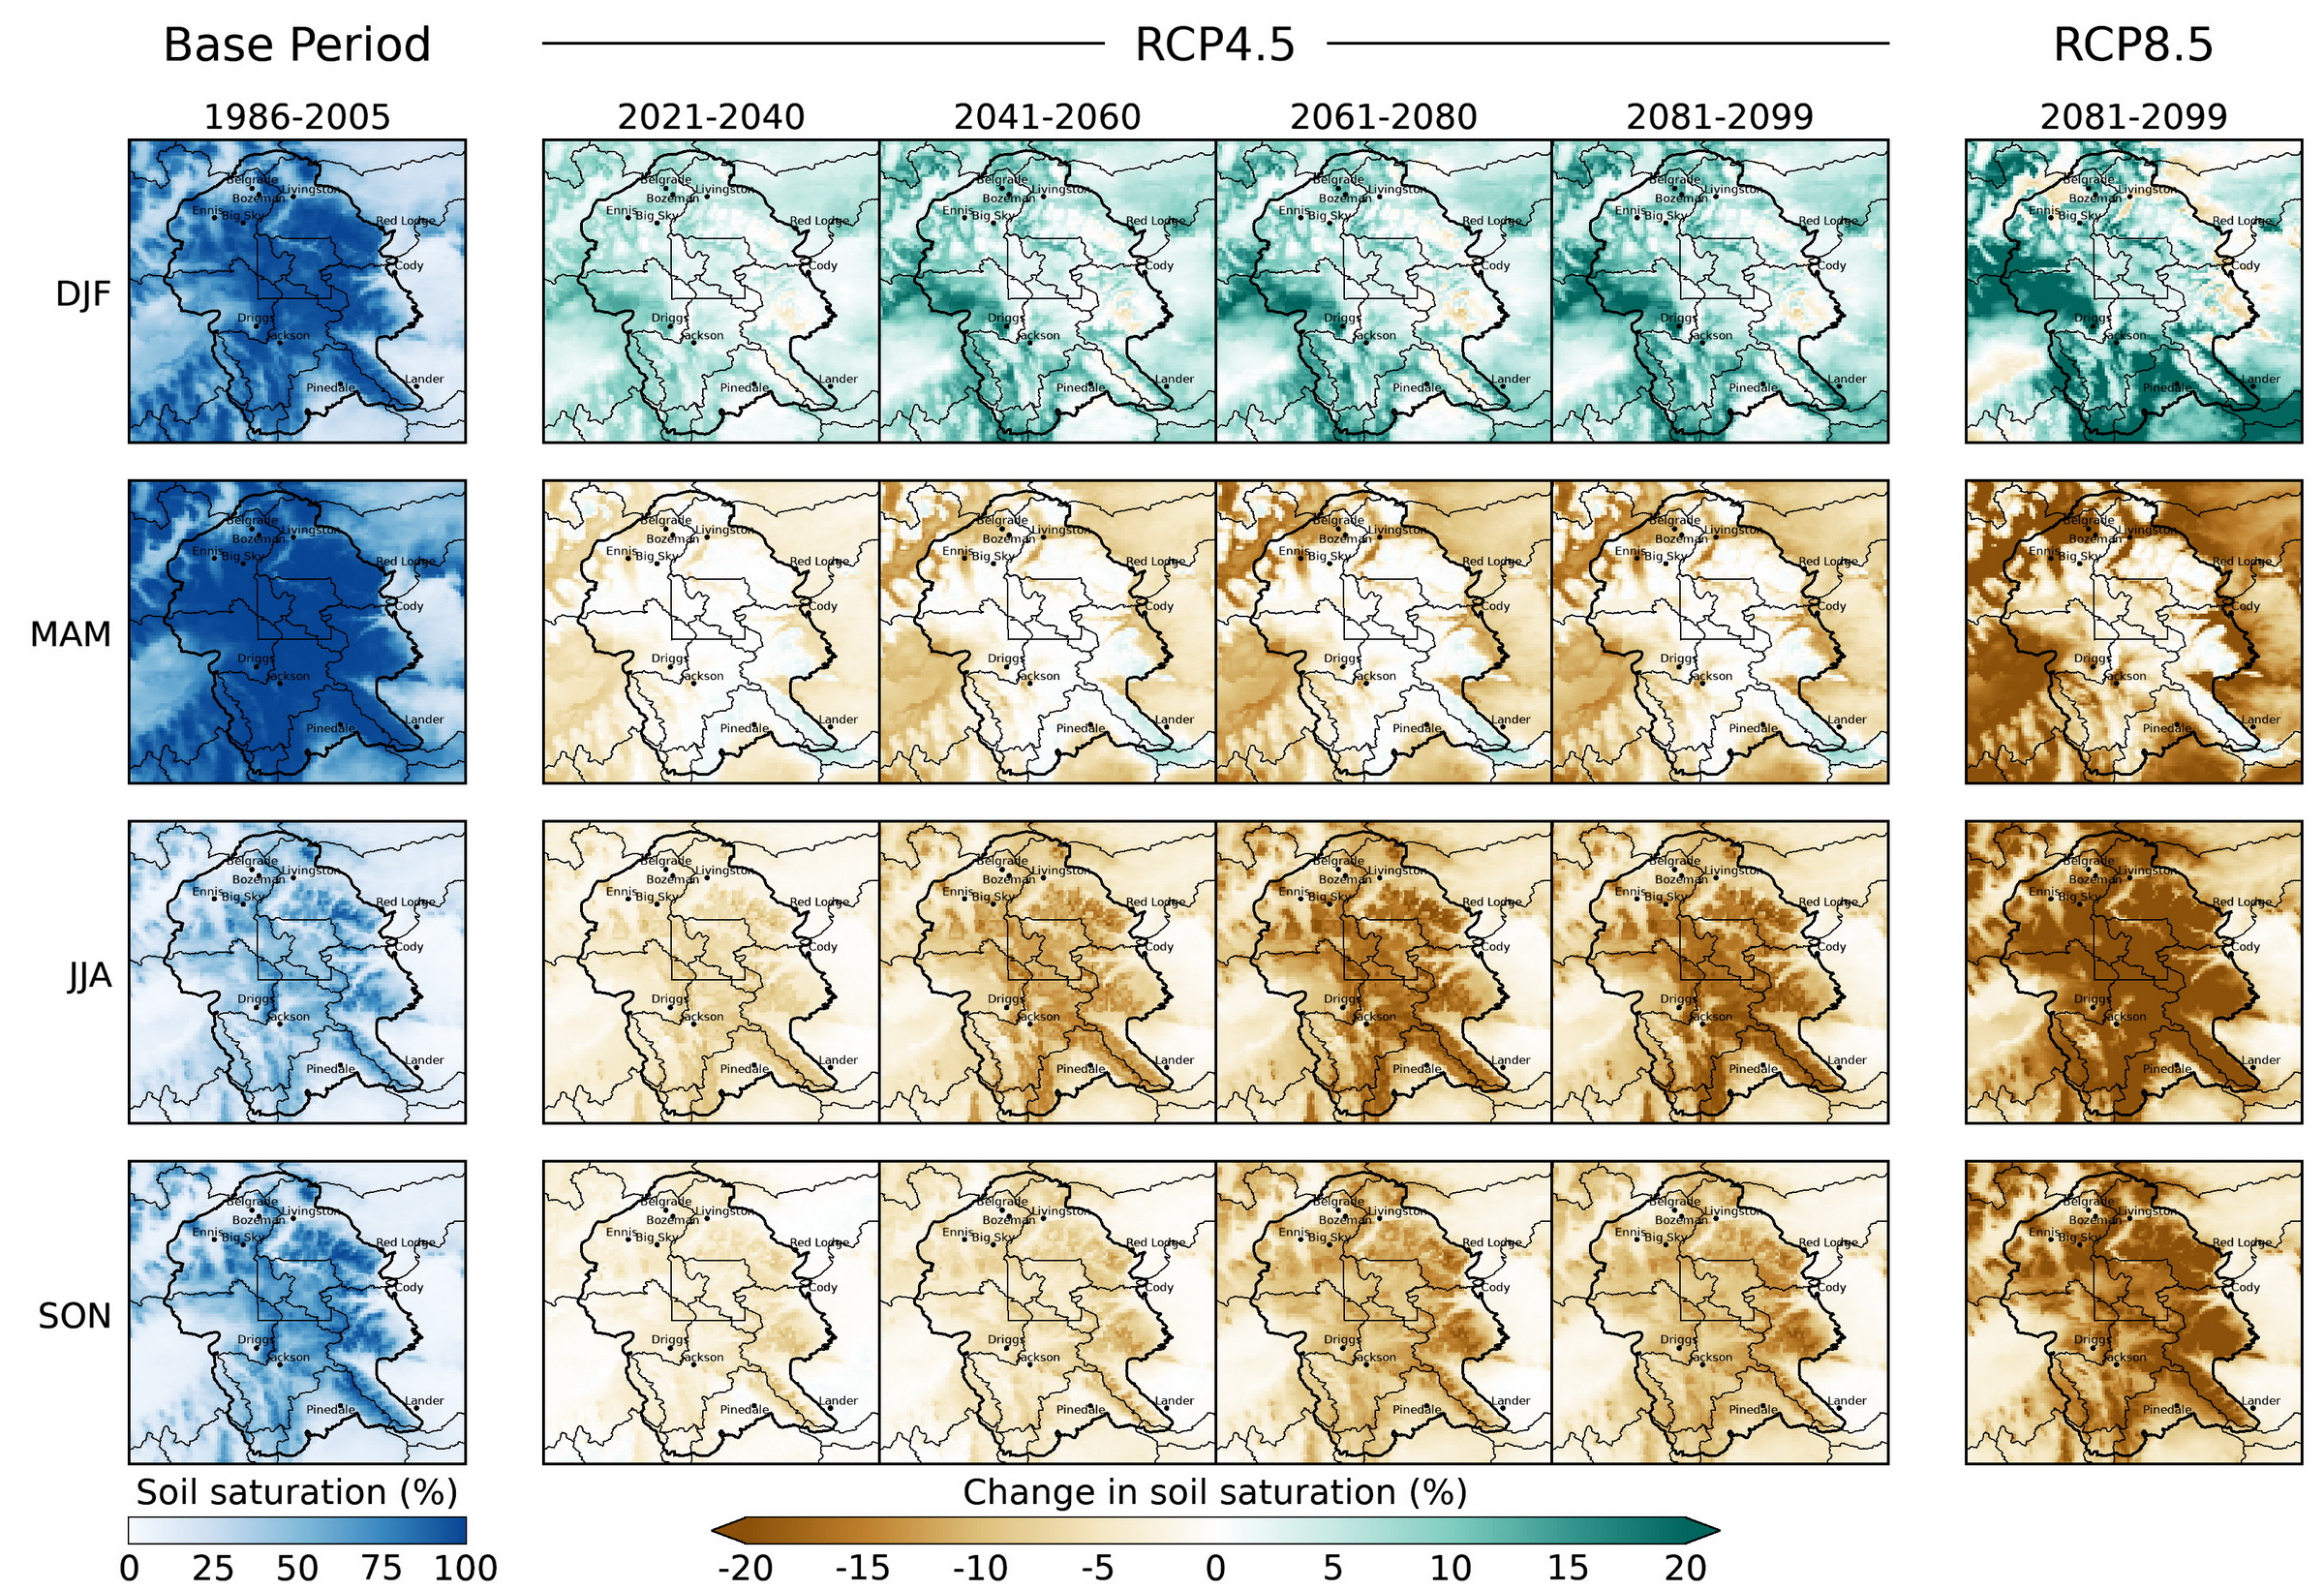
Figure 7-10. Seasonal mean soil moisture saturation in the Greater Yellowstone Area for the 1986-2005 base period (left column), changes under Representative Concentration Pathway 4.5 (RCP4.5, four center columns), and changes at the end of the 21st century under RCP8.5 (right column), as simulated by the water balance model. The values are expressed as percentages relative to full water-holding capacity (100%) of the 1-m (39.4-inch) soil layer used in the model (see appendix to this chapter for further details). The seasons (e.g., December-February [DJF]) are arranged in rows and the changes relative to the 1986-2005 base period for each future period (e.g., 2021-2040) are in columns. Shown are the 20-model means of the simulations that used MACAv2-METDATA data as model input. See Figure A7.4 for RCP8.5.
The checkerboard plot (Figure 7-11) shows the emerging seasonal change of soil water in the HUC6 watersheds and GYA through the 21st century. As in previous figures, each rectangular grid in Figure 7-11 illustrates the differences (anomalies) between a given period and the base period (e.g., 2021-2040 minus 1986-2005) broken down by monthly and annual means, for the GYA and each HUC6 watershed.
Winter increases are accompanied by summer decreases. The largest decreases occur in May through July and again in October when increased evapotranspiration extracts more soil moisture. The smaller relative changes in August and September reflect the limitation on how much water can be extracted from the already dry soil in the 1986-2005 base period.
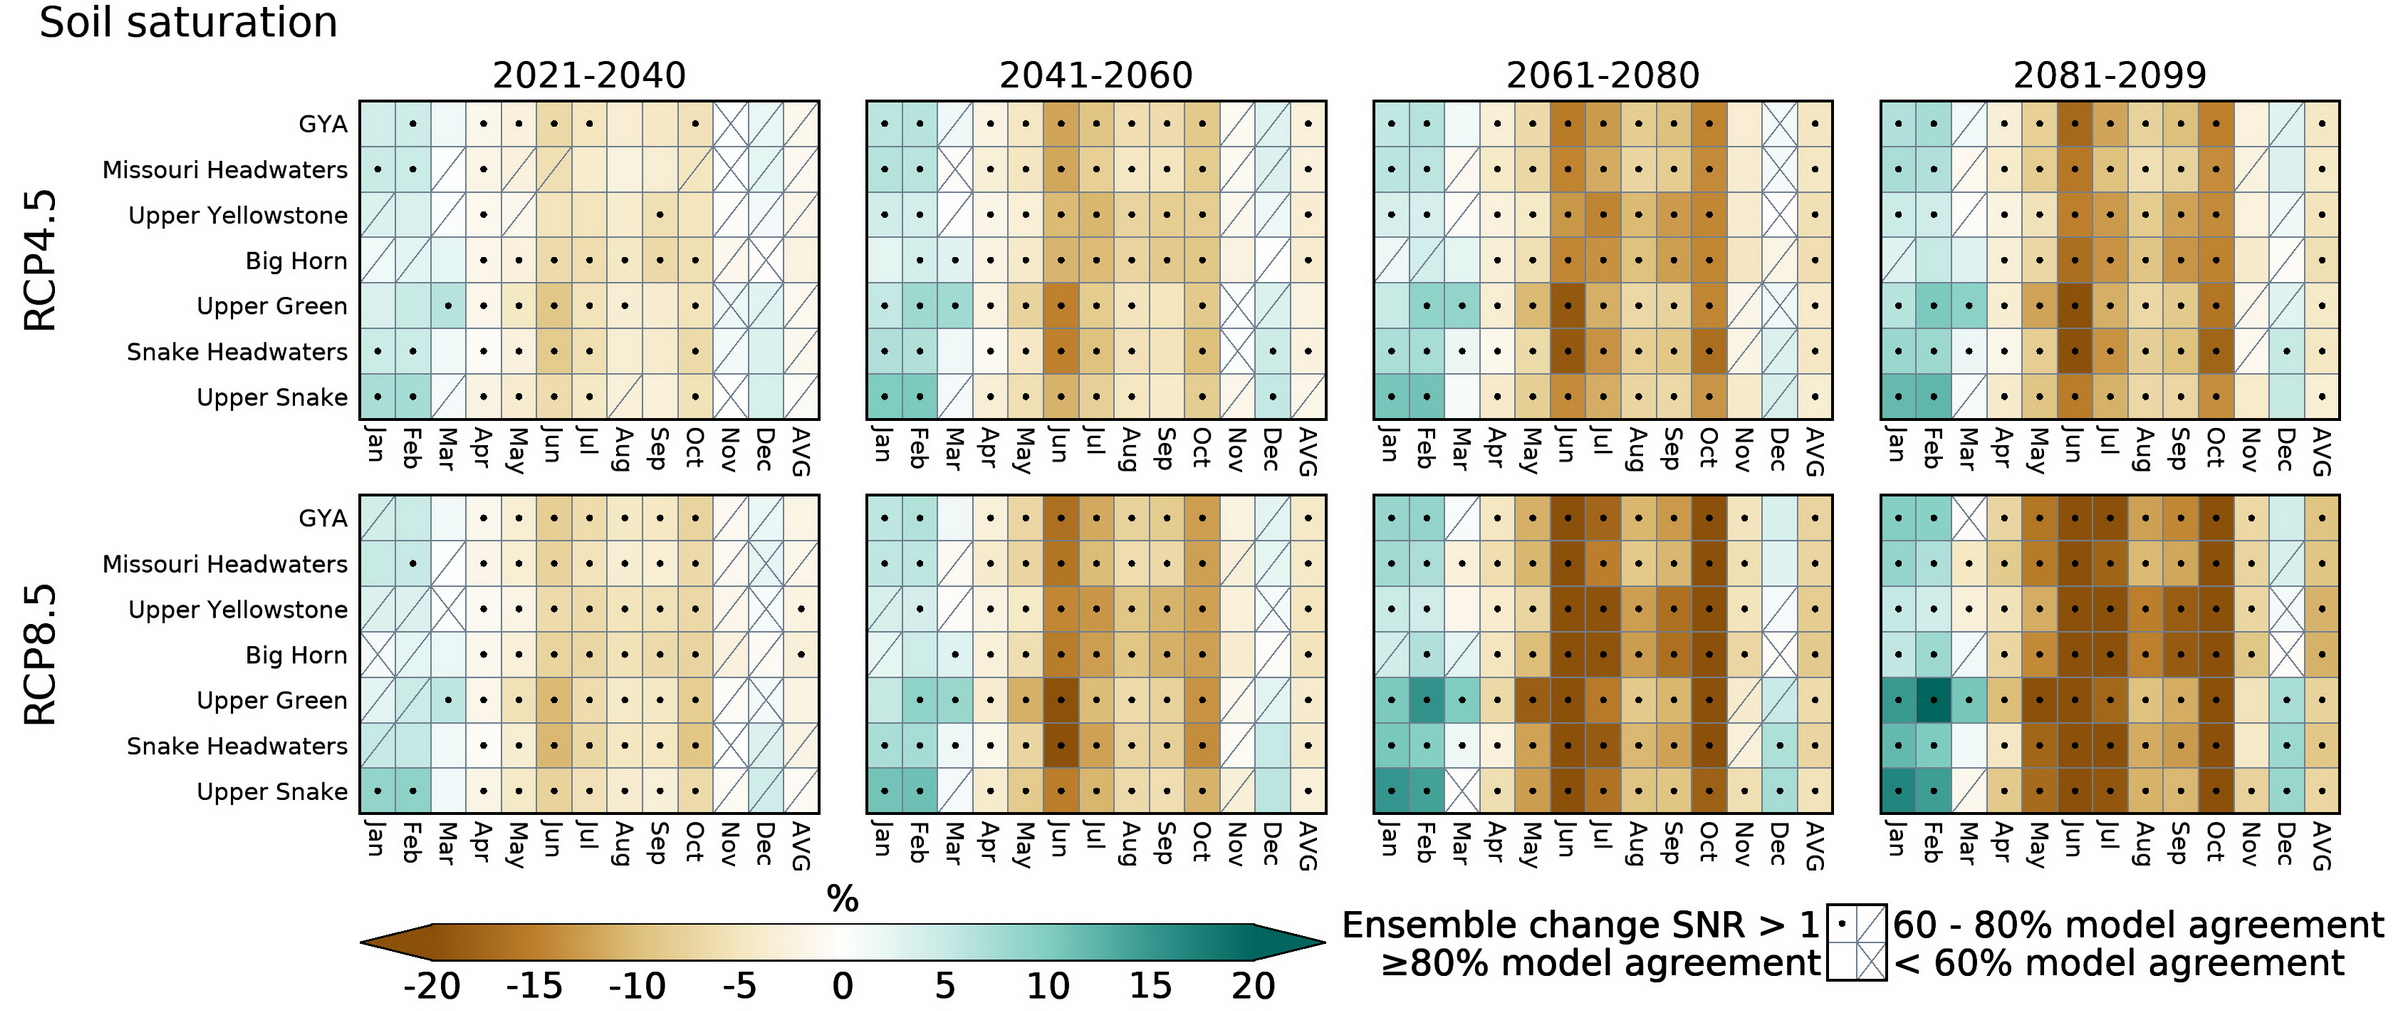
Figure 7-11. Change in monthly and annual mean soil moisture saturation over the Hydrologic Unit Code 6 (HUC6) watersheds and Greater Yellowstone Area (GYA), as simulated by the water balance model. The values are expressed as percentages relative to full water-holding capacity (100%) of the 1-m (39.4-inch) soil layer used in the model (see appendix to this chapter for further details). The columns from left to right show changes for each future period (e.g., 2021-2040) relative to the 1986-2005 base period with Representative Concentration Pathway 4.5 (RCP4.5) on the top row and RCP8.5 on the bottom row. In each RCP figure, the months and annual mean (AVG) run from left to right across the horizontal axis on the bottom and the HUC6 watersheds and GYA run along the vertical axis on the left. Colored cells indicate >80% (more than 16 of the 20 models) agree on the sign of the change in the median value (positive or negative). A slash in a colored cell indicates that 60-80% of the models (12-16 out of 20) agree on the sign of the change, and an X in a box indicates that fewer than 60% (<12) of the models agree on the sign of the change. A black dot in a box indicates that the ensemble mean value of the future change is greater than the inter-model standard deviation (SNR >1), an indicator of significance of the change (see Chapter 1 for details). Shown are the 20-model means of the simulations that used the MACAv2-METDATA data as model input.
The combined projected changes in P-PET and soil moisture content indicate that the magnitude and duration of the today’s summer and fall period of water deficit will be greater in the future. There is a high level of model agreement (>80%) and SNRs >1 for the changes. These projections are based on climatological means over 20-year periods with a range of variability attributed to the 20 climate models used in the Assessment. Shorter-term, more severe drought conditions not captured by the models are likely to occur in the future just as they have in past. Future droughts will occur under warmer average conditions and hence have the potential to be more extreme than those of the past or present.
Future droughts will occur under warmer average conditions and hence have the potential to be more extreme than those of the past or present.
GYA is world renowned as a destination for skiing, snowboarding, snowmobiling, ice climbing, dogsledding, ice fishing, and other winter activities (see figure). In the future, these recreational opportunities—and associated economies—will be threatened by the continued loss of snowpack as the GYA snow season becomes shorter and more uncertain.
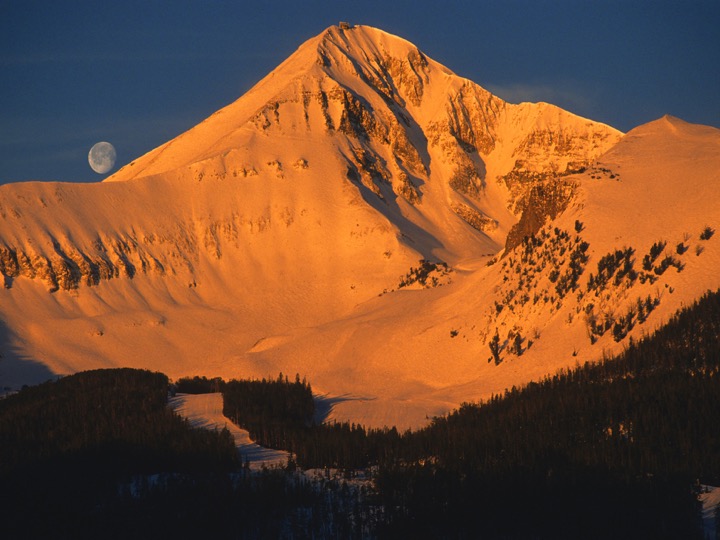
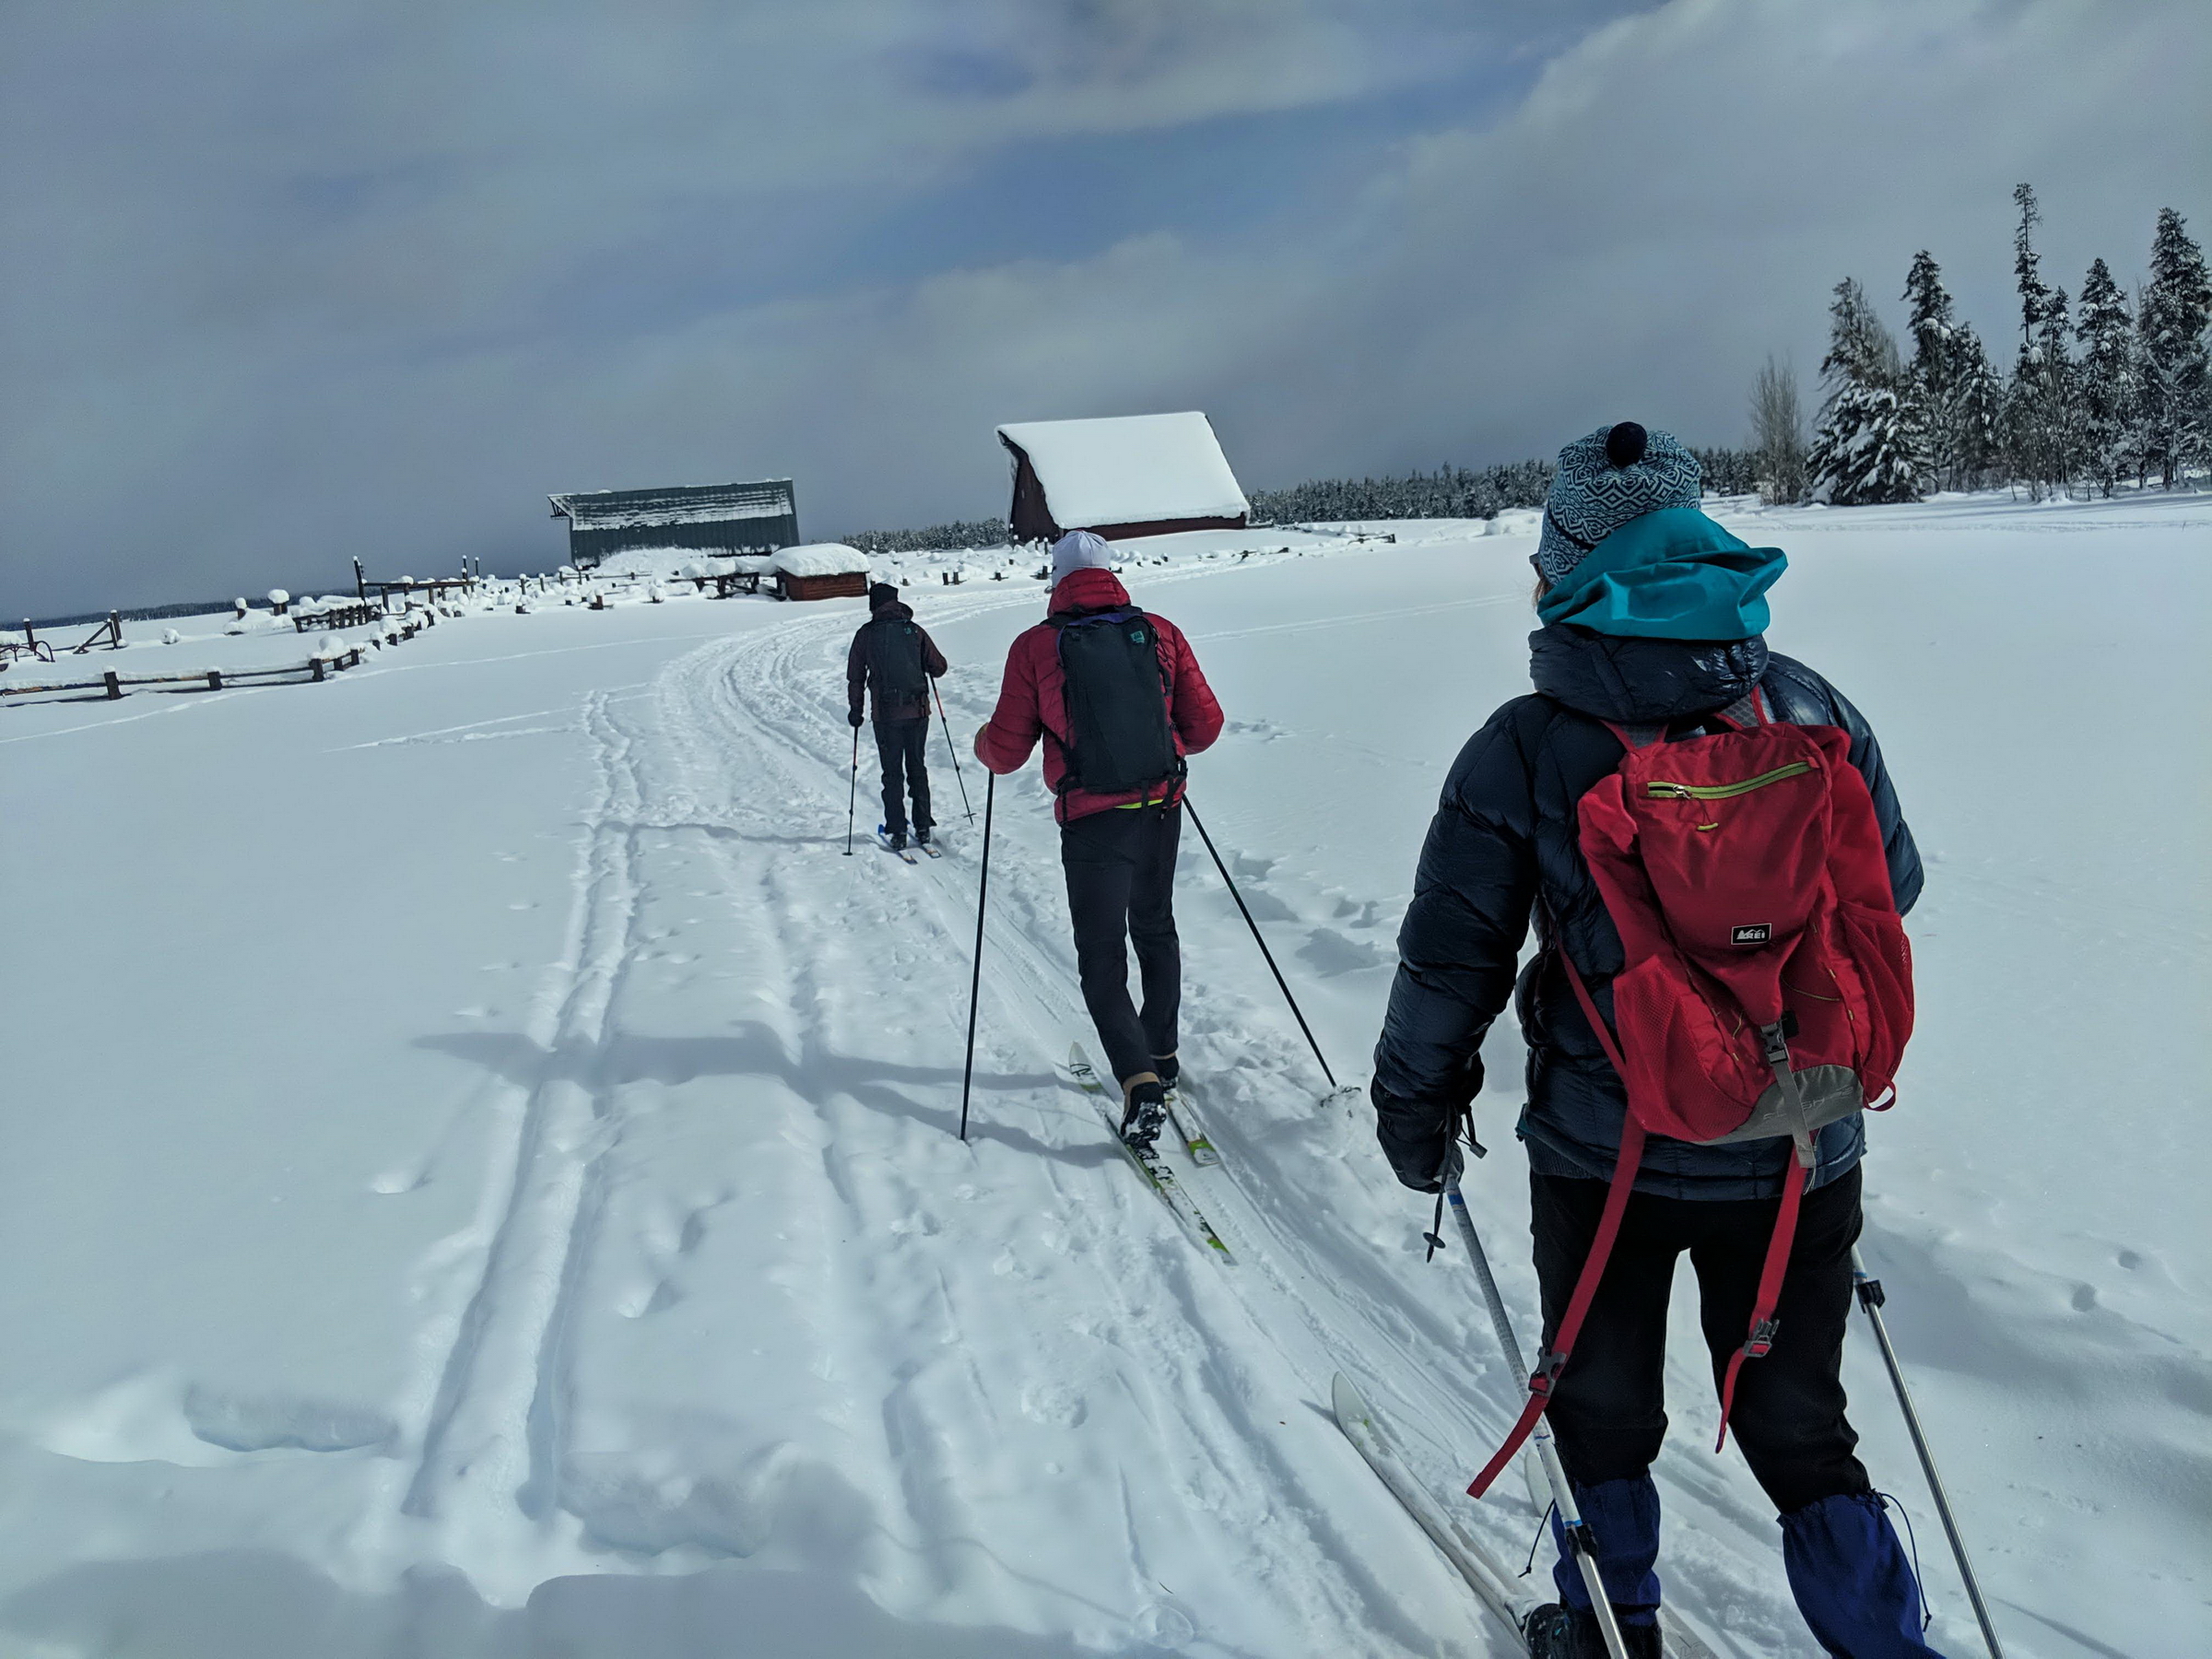

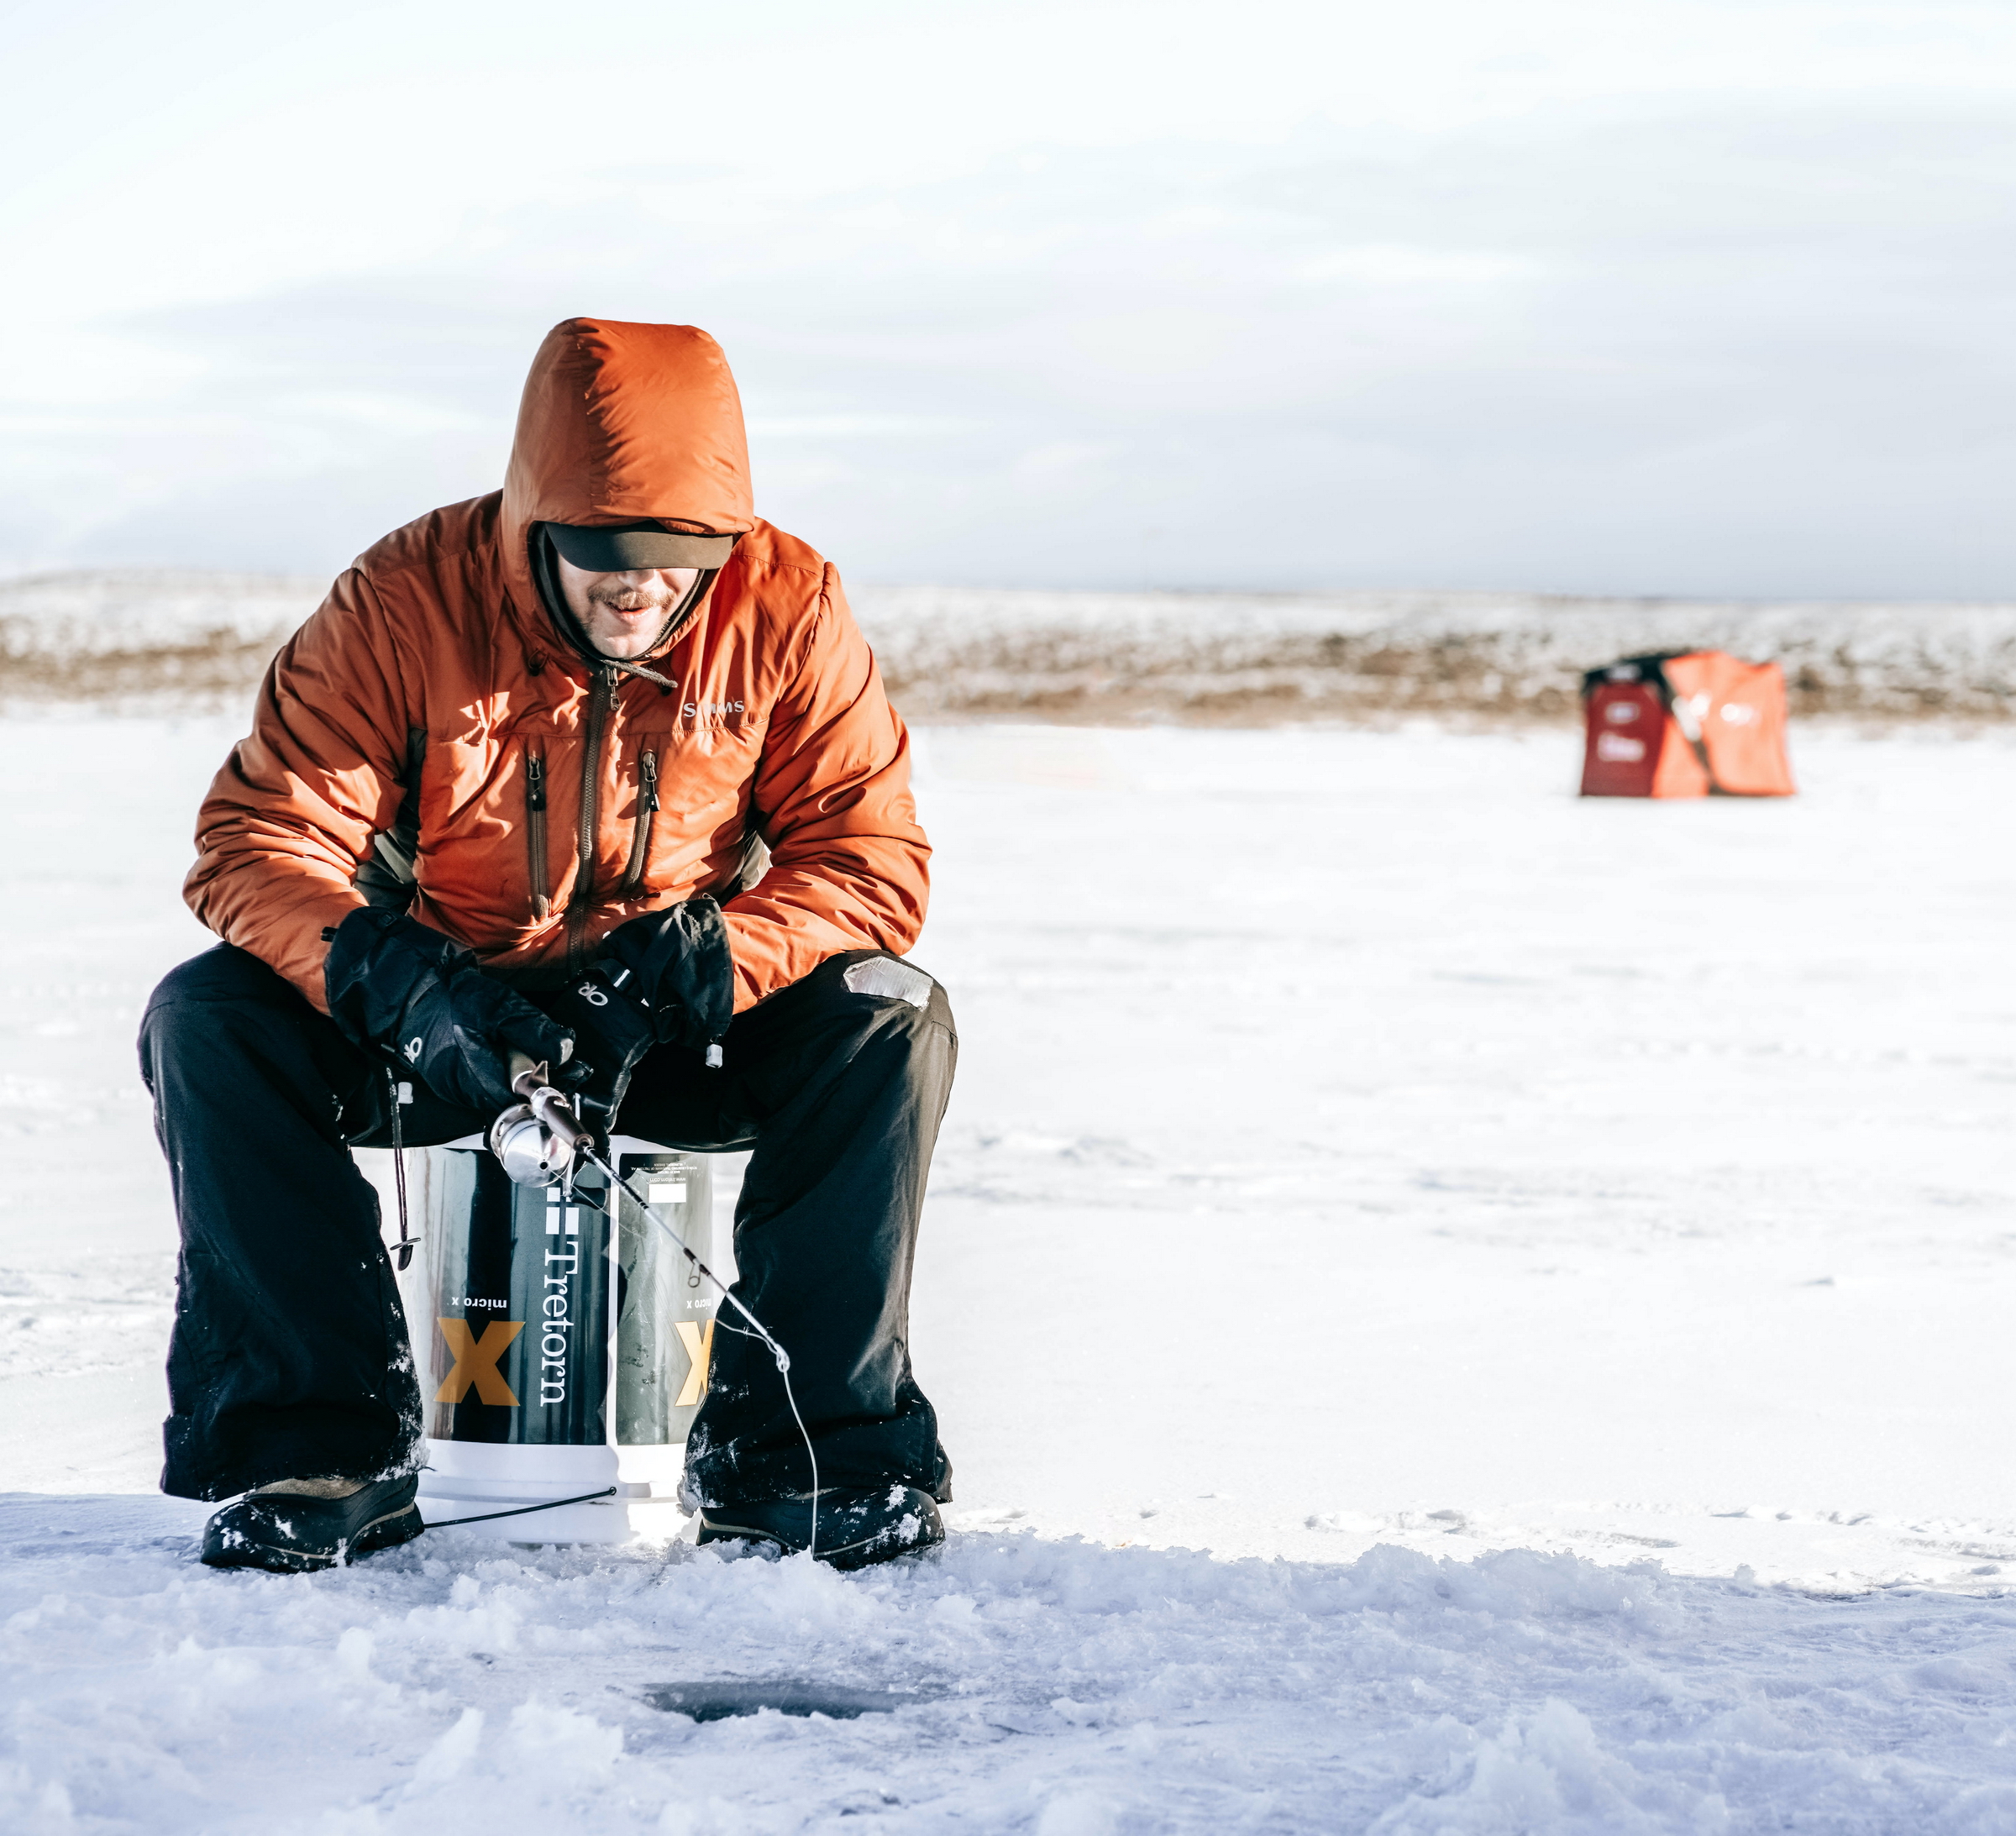
Winter recreational opportunities, and the associated economies, will be threatened as the climate warms and snowpack is lost. (Photo credits, from top: Rick and Susie Graetz, Scott Bischke, JMT Photography/Pexels, and Glenn Claire/Upsplash)
Consistent with most of the mountainous western United States, annual snowpack in the GYA is declining. Since 1950, snowfall at an elevation of 8000 ft in the GYA has decreased by 3.5 inches (8.9 cm)/decade (about 25%), so nearly 24 inches (61 cm) less snow now falls annually (see Chapter 3).
Snowpack of the 1990s and early 2000s in the GYA, as measured by snow water equivalent on April 1st, was at least 20% lower than the average of the past 8 centuries (see Chapter 3; Pederson et al. 2011). The observed loss of snowfall and snowpack in the GYA is attributed to warmer temperatures from November through April (Tercek at al. 2015), increased precipitation in spring and fall, and decreased precipitation in winter and summer (see Chapter 3).
Decreases in snowpack are projected to continue in the future (Figures 7.1 and A7.1). As winters warm, a smaller portion of precipitation will fall as snow (Table 7.1) and more precipitation will be a mixture of rain and snow. Under RCP4.5, mid-century loss of snowpack ranges between 24 and 31% of 1986-2005 levels and reaches 38-44% by the end of century (Figure 7.2 and Table 7.1). Losses are much greater under the warmer conditions of RCP8.5.
Elevational changes in snow will affect most aspects of winter recreation in the GYA. In Yellowstone National Park, for example, Tercek and Rodman (2015) found that the length of the snow season at the end of century (2061-2090) could decline by 16 and 27% over present under RCP4.5 and RCP8.5, respectively, with similar or greater declines in the number of days suitable for over-snow vehicles. Lackner et al. (2021) projected that under RCP8.5 over the 30-year period centered on 2050, the number of ski days during the core of the season will be reduced from 6 to 29 days at ski areas within the GYA.
Summary
Projected snow changes.—Under RCP4.5, the total area of the GYA dominated by winter snowfall decreases from 59% during the base period (1986-2005) to 27% at mid century (2041-2060) and to 11% by the end of century (2081-2099). Under RCP8.5, the extent of snow-dominant area decreases to 17% and to 1% for the same time periods, respectively. There is >80% model agreement and SNR >1 for the changes. The amount of water stored in the snowpack decreases over the GYA and all HUC6 watersheds. The projected loss of water in the snowpack is consistent with previous studies in the region (e.g., Klos et al. 2014; Tennant et al. 2015; Tersek and Rodman 2015; Whitlock et al. 2017; Conant et al. 2018; Alder and Hostetler 2019). The RCP4.5 and RCP8.5 snowpack trajectories mirror those of temperature for the HUC6 watersheds shown in Figure 5-4, illustrating the strong dependence of snowpack on temperature. The snow projections are likely an upper bound on future changes that may occur because the spatial resolution of our water balance model is relatively coarse, and the model does not account for sublimation, wind, and local, non-climatic factors such as slope, aspect, and shading. Such factors influence the rate and distribution of local changes in snow accumulation and snowmelt (e.g., Watson et al. 2008; Pavelsky et al. 2012).
Projected runoff changes.—Under both RCP4.5 and RCP8.5, the amount of total annual runoff increases slightly (from 1 to 3%) through the 21st century in the GYA and HUC6 watersheds. The increases are related to shifting seasonality (Table 7-2). There is varying model agreement by time period (Figure 7-7 and Table 7-2). Under both RCP4.5 and RCP8.5, there is 90-100% model agreement and SNR >1 for the projected shifts in seasonal and monthly runoff during winter, spring, and summer. These findings are consistent with previous studies (Tennant et al. 2015; Whitlock et al. 2017; Alder and Hostetler 2019; Livneh and Badger 2020).
Precipitation minus Potential Evapotranspiration and water deficit.—Over the GYA and HUC6 watersheds, potential evapotranspiration (PET) demand exceeds precipitation (P) during summer (June through September), leading to water deficits, particularly at lower elevations. Under RCP4.5, the GYA summer water deficit is projected to increase by 25% at mid century and 36% by the end of century. Under RCP8.5, projected water deficit increases are 35% by mid century and 79% by the end of century (Table 7-3). Under RCP4.5, by mid century (2041-2060) summer deficit increases in the HUC6 watersheds range from 16% in the Upper Snake to 39% in the Upper Yellowstone. By the end of the century (2081-2099), the increases range from 25 to 53% in those watersheds. Under RCP8.5, deficit increases range from 24% in the Upper Snake to 51% in the Upper Yellowstone by mid century, and from 54 to 114% in those watersheds by the end of the century.
Soil moisture.—Summer soil moisture levels are about 25% of capacity over low elevations and 50% of capacity at higher elevations of the GYA during the 1986-2005 base period. Under RCP4.5, June-October soil moisture saturation decreases by 23% at mid century and 33% by the end of the century. Under RCP8.5, June-October soil moisture saturation decreases by 30% mid century and by 56% by the end of the century. There is >80% model agreement and SNRs >1 for the changes. These changes in average conditions will likely intensify summer drought in the GYA and HUC6 watersheds.
Chapter 7 Appendix—A Deeper Look
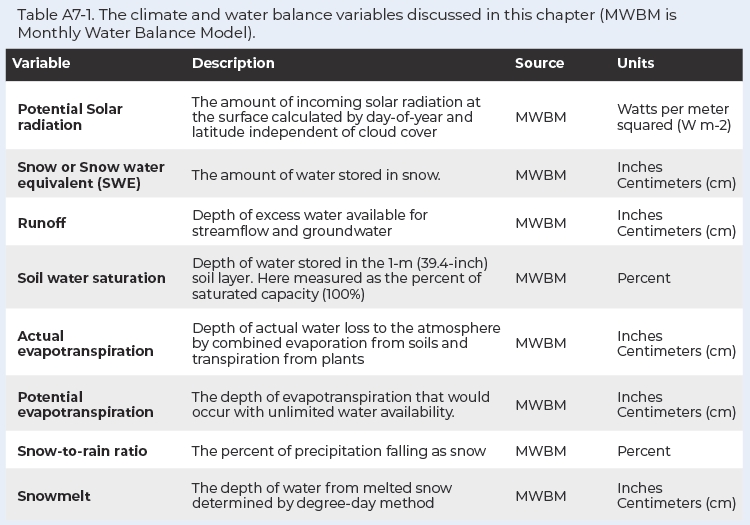
Climate variables
The variables discussed in this chapter are summarized in Table A7-1.
The water balance model
The monthly water balance model accounts for the partitioning of water through the various components of the hydrological system (McCabe and Markstrom 2007). Air temperature determines the portion of precipitation that falls as rain or snow, the accumulation and melting of the snowpack, and actual evapotranspiration. Snowmelt is calculated by a degree-day method and potential evapotranspiration is determined from temperature and potential solar radiation by the Oudin method (Oudin et al. 2005). Rain and melting snow are partitioned into direct surface runoff, soil moisture, and surplus runoff that occurs when the soil layer reaches 100% saturation. The soil layer has a 1-m (39.4-inch) rooting depth and spatially variable water holding capacity derived from the State Soil Geographic Data Base (Viger and Bock 2014; Schwarz and Alexander 1995; Wolock 1997).
The model has been applied to climate-hydrology studies (e.g., Wolock and McCabe 1999; McCabe and Wolock 2011a,b; McCabe et al. 2013) including the GYA (Gray and McCabe 2010; Pederson et al. 2013; Hostetler and Alder 2016; Alder and Hostetler 2019; Battaglin et al. 2020). The model is also used to provide CMIP5 climate change and hydrological data for the conterminous United States (https://doi.org/10.5066/F7W9575T). Computer code for implementing a default version of the model is available from the National Center for Atmospheric Research (https://www.ncl.ucar.edu/Applications/crop.shtml, accessed February 2021).
Some details of the model include:
-
the model is run on a monthly time step, so it does not capture day-to-day variability nor extreme events such as intense precipitation and floods;
-
surface elevation is implicit through the MACAv2-METDATA temperature and precipitation data, but the model does not account for detail of slope or aspect below the resolution of the 4‑km by 4-km (2.5-mile by 2.5-mile) grid cells used in the Assessment;
-
while physically based, the model simplifies more complex energy balance details that determine evapotranspiration and snow dynamics; and
-
the model simulates the runoff of a grid cell but does not route runoff among grid cells or into stream networks or groundwater.
Accordingly, for the Greater Yellowstone Climate Assessment the model is intended to provide a reasonable estimate of hydrologic change over the 21st century. More detailed analyses in the next phase of the GYA Assessment, such as modeling potentially complex local changes in snow, streamflow and groundwater and their interaction, will require more detailed representations of the underlying processes and calibration in catchments.
Figures supporting Chapter 7
Details of Figures 7-1 and A7-1 snow graphics.—In Figures 7-1 and A7-1, we map and plot the unitless ratio of the maximum amount of water stored in the snow (i.e., the snowpack) from October through April, which is referred to as the snow water equivalent (SWE), to total precipitation (P) over the same period, SWE:P. The ratio implicitly accounts for changes in precipitation and temperature on snow accumulation (Serreze et al. 1999; Mantua et al. 2010; Sproles et al. 2017). As shown in the color bars at the bottom of the figures, we follow Mantua et al. (2010) in specifying three zones of the ratio, which in GYA are related to elevation:
-
rain-dominated, where most precipitation falls as rain (SWE:P values < 0.1, green in the figures);
-
rain-snow mix, where precipitation falls as a mix of rain and snow (0.1 ≤ SWE:P < 0.4, orange and red colors in the figures) with the lowest range indicating more rain and the highest range more snow; and
-
snow-dominant zone (SWE:P ≥ 0.4, blue colors in the figures), where most precipitation falls as snow.
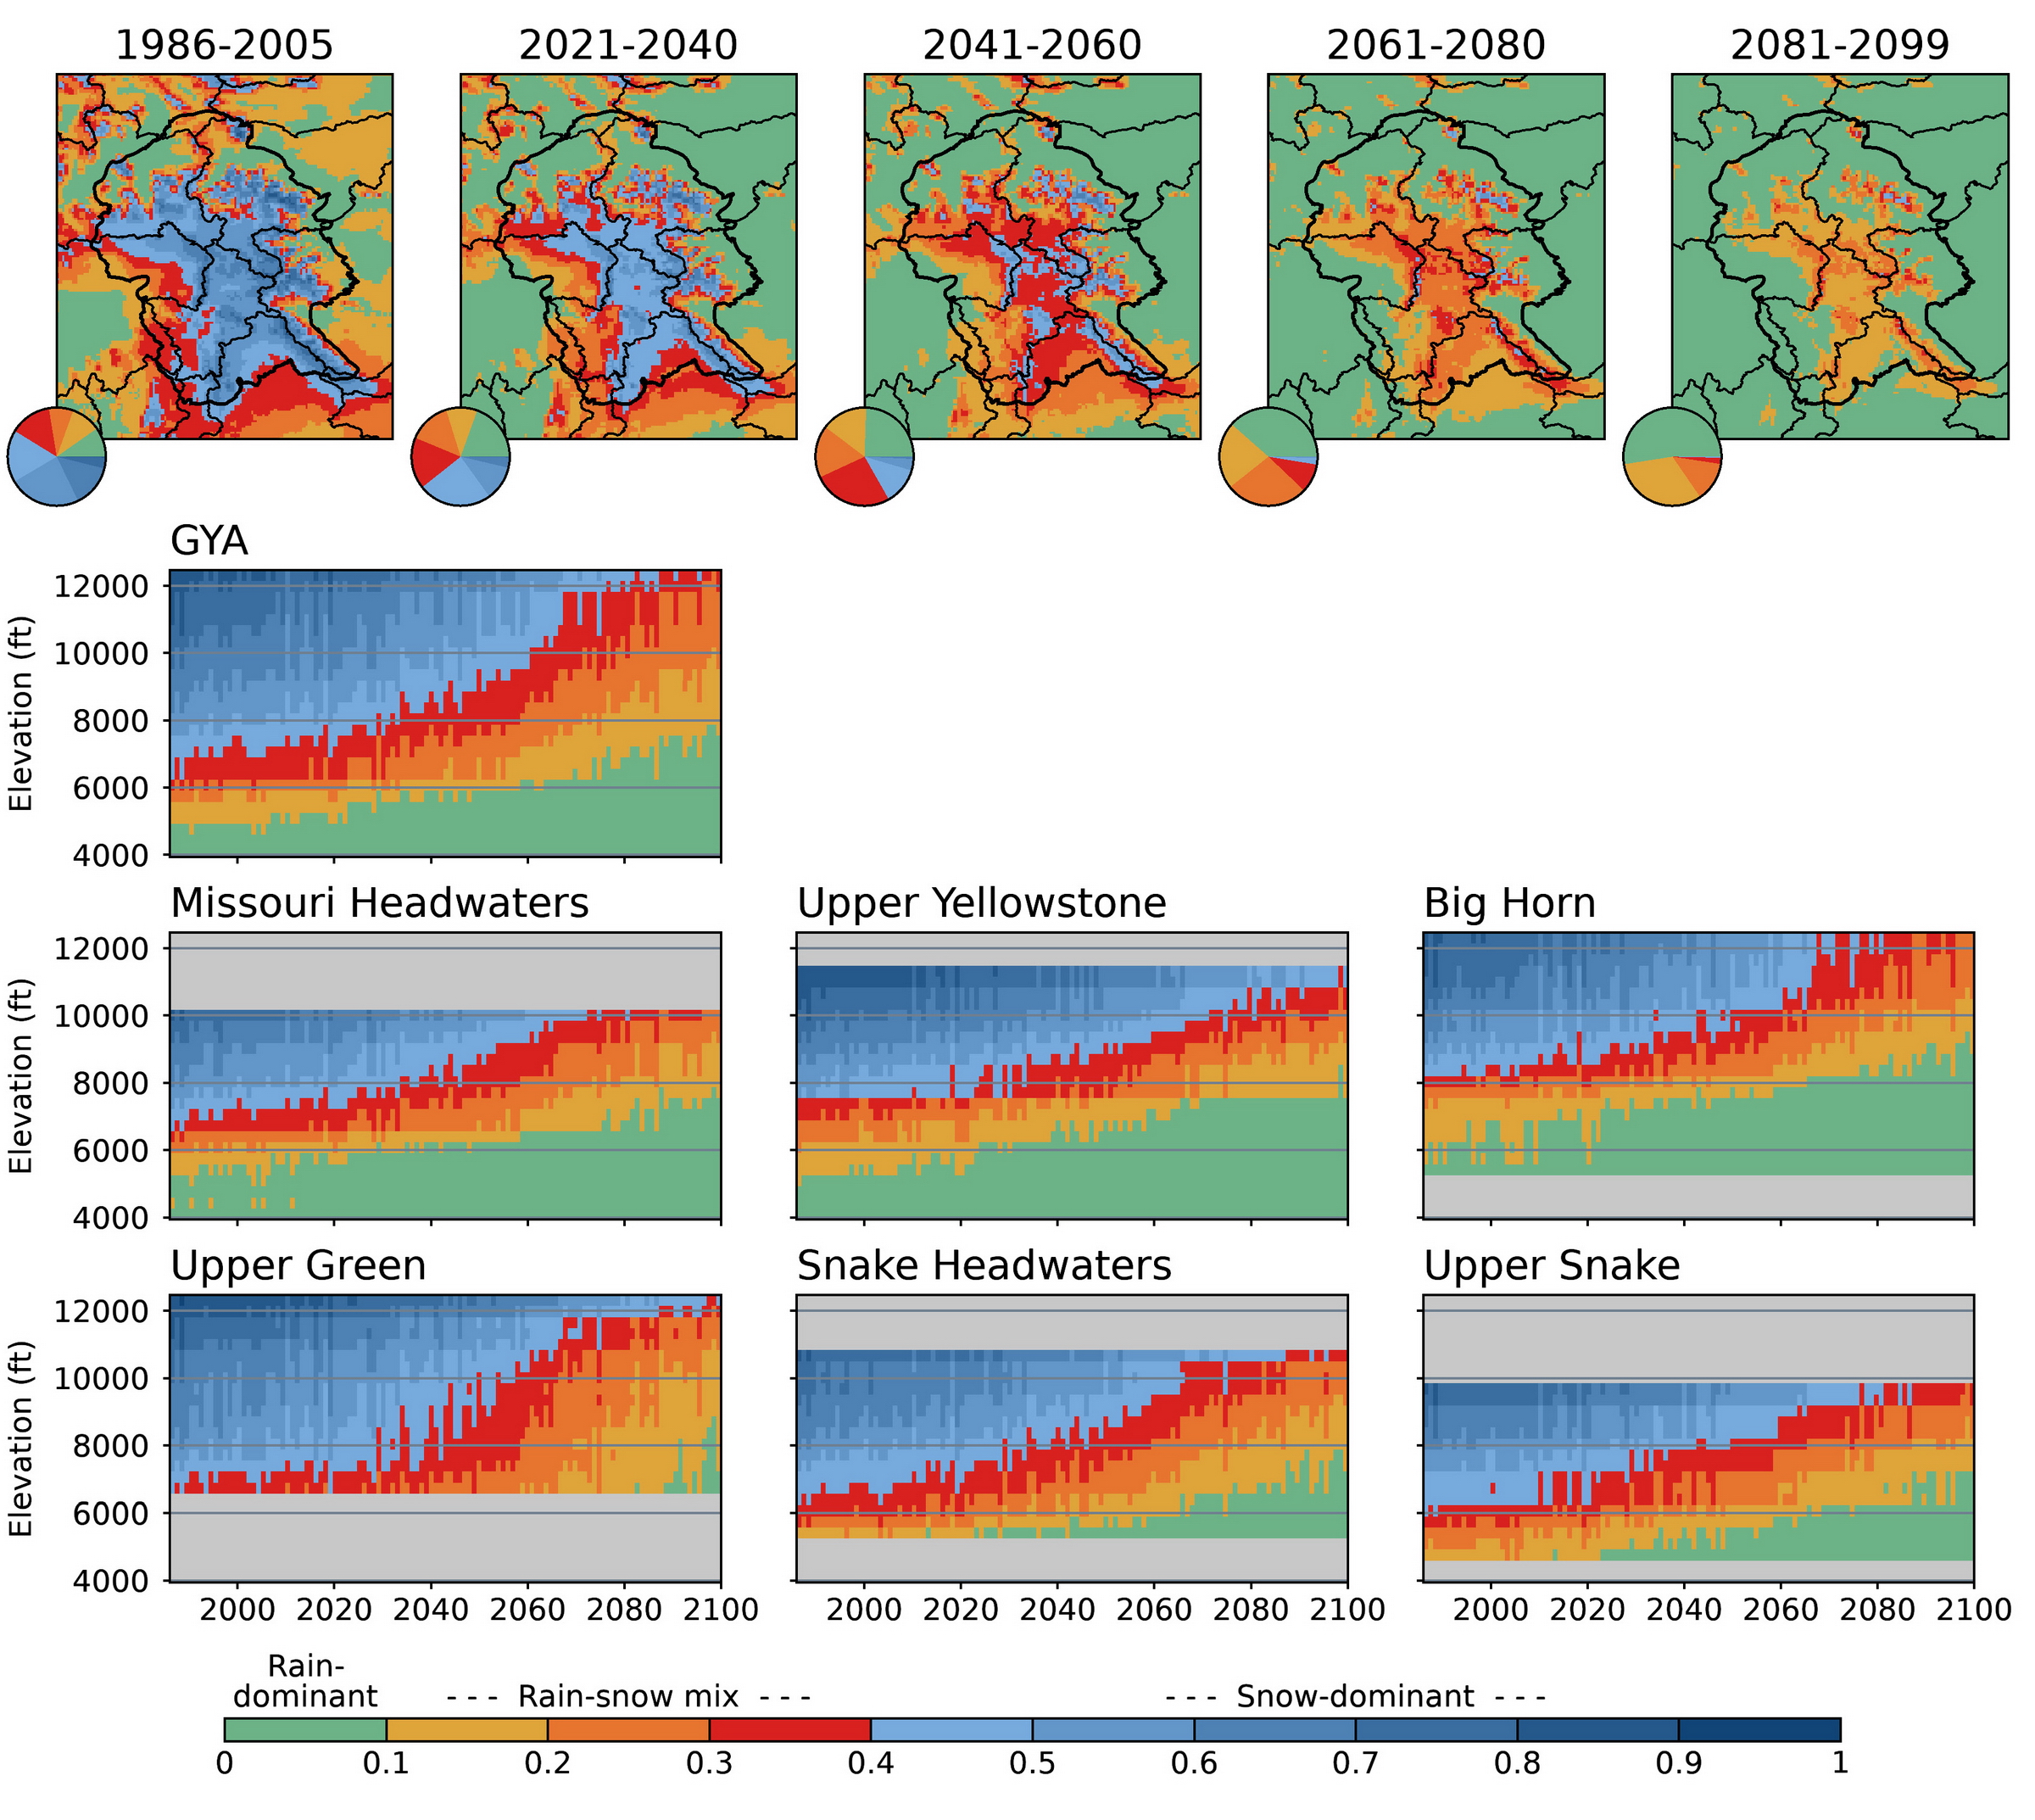
Figure A7-1. The 1986-2099 annual snow regime for the Hydrologic Unit Code 6 (HUC6) watersheds under Representative Concentration Pathway 8.5 (RCP8.5), as simulated by the water balance model. The five maps across the top display the ratio of maximum snow water equivalent (SWE) to total cold-season (Oct-Apr) precipitation (P) SWE:P for the indicated time periods. The pie charts inset in the maps show the fraction of Greater Yellowstone Area (GYA) area within each SWE:P category. The time-elevation plots for the HUC6 watersheds in the bottom two rows display the trend in SWE:P ratio from 1986-2099 averaged over 330 ft (100 m) elevation bands. Gray shading indicates elevations not present in the HUCs.
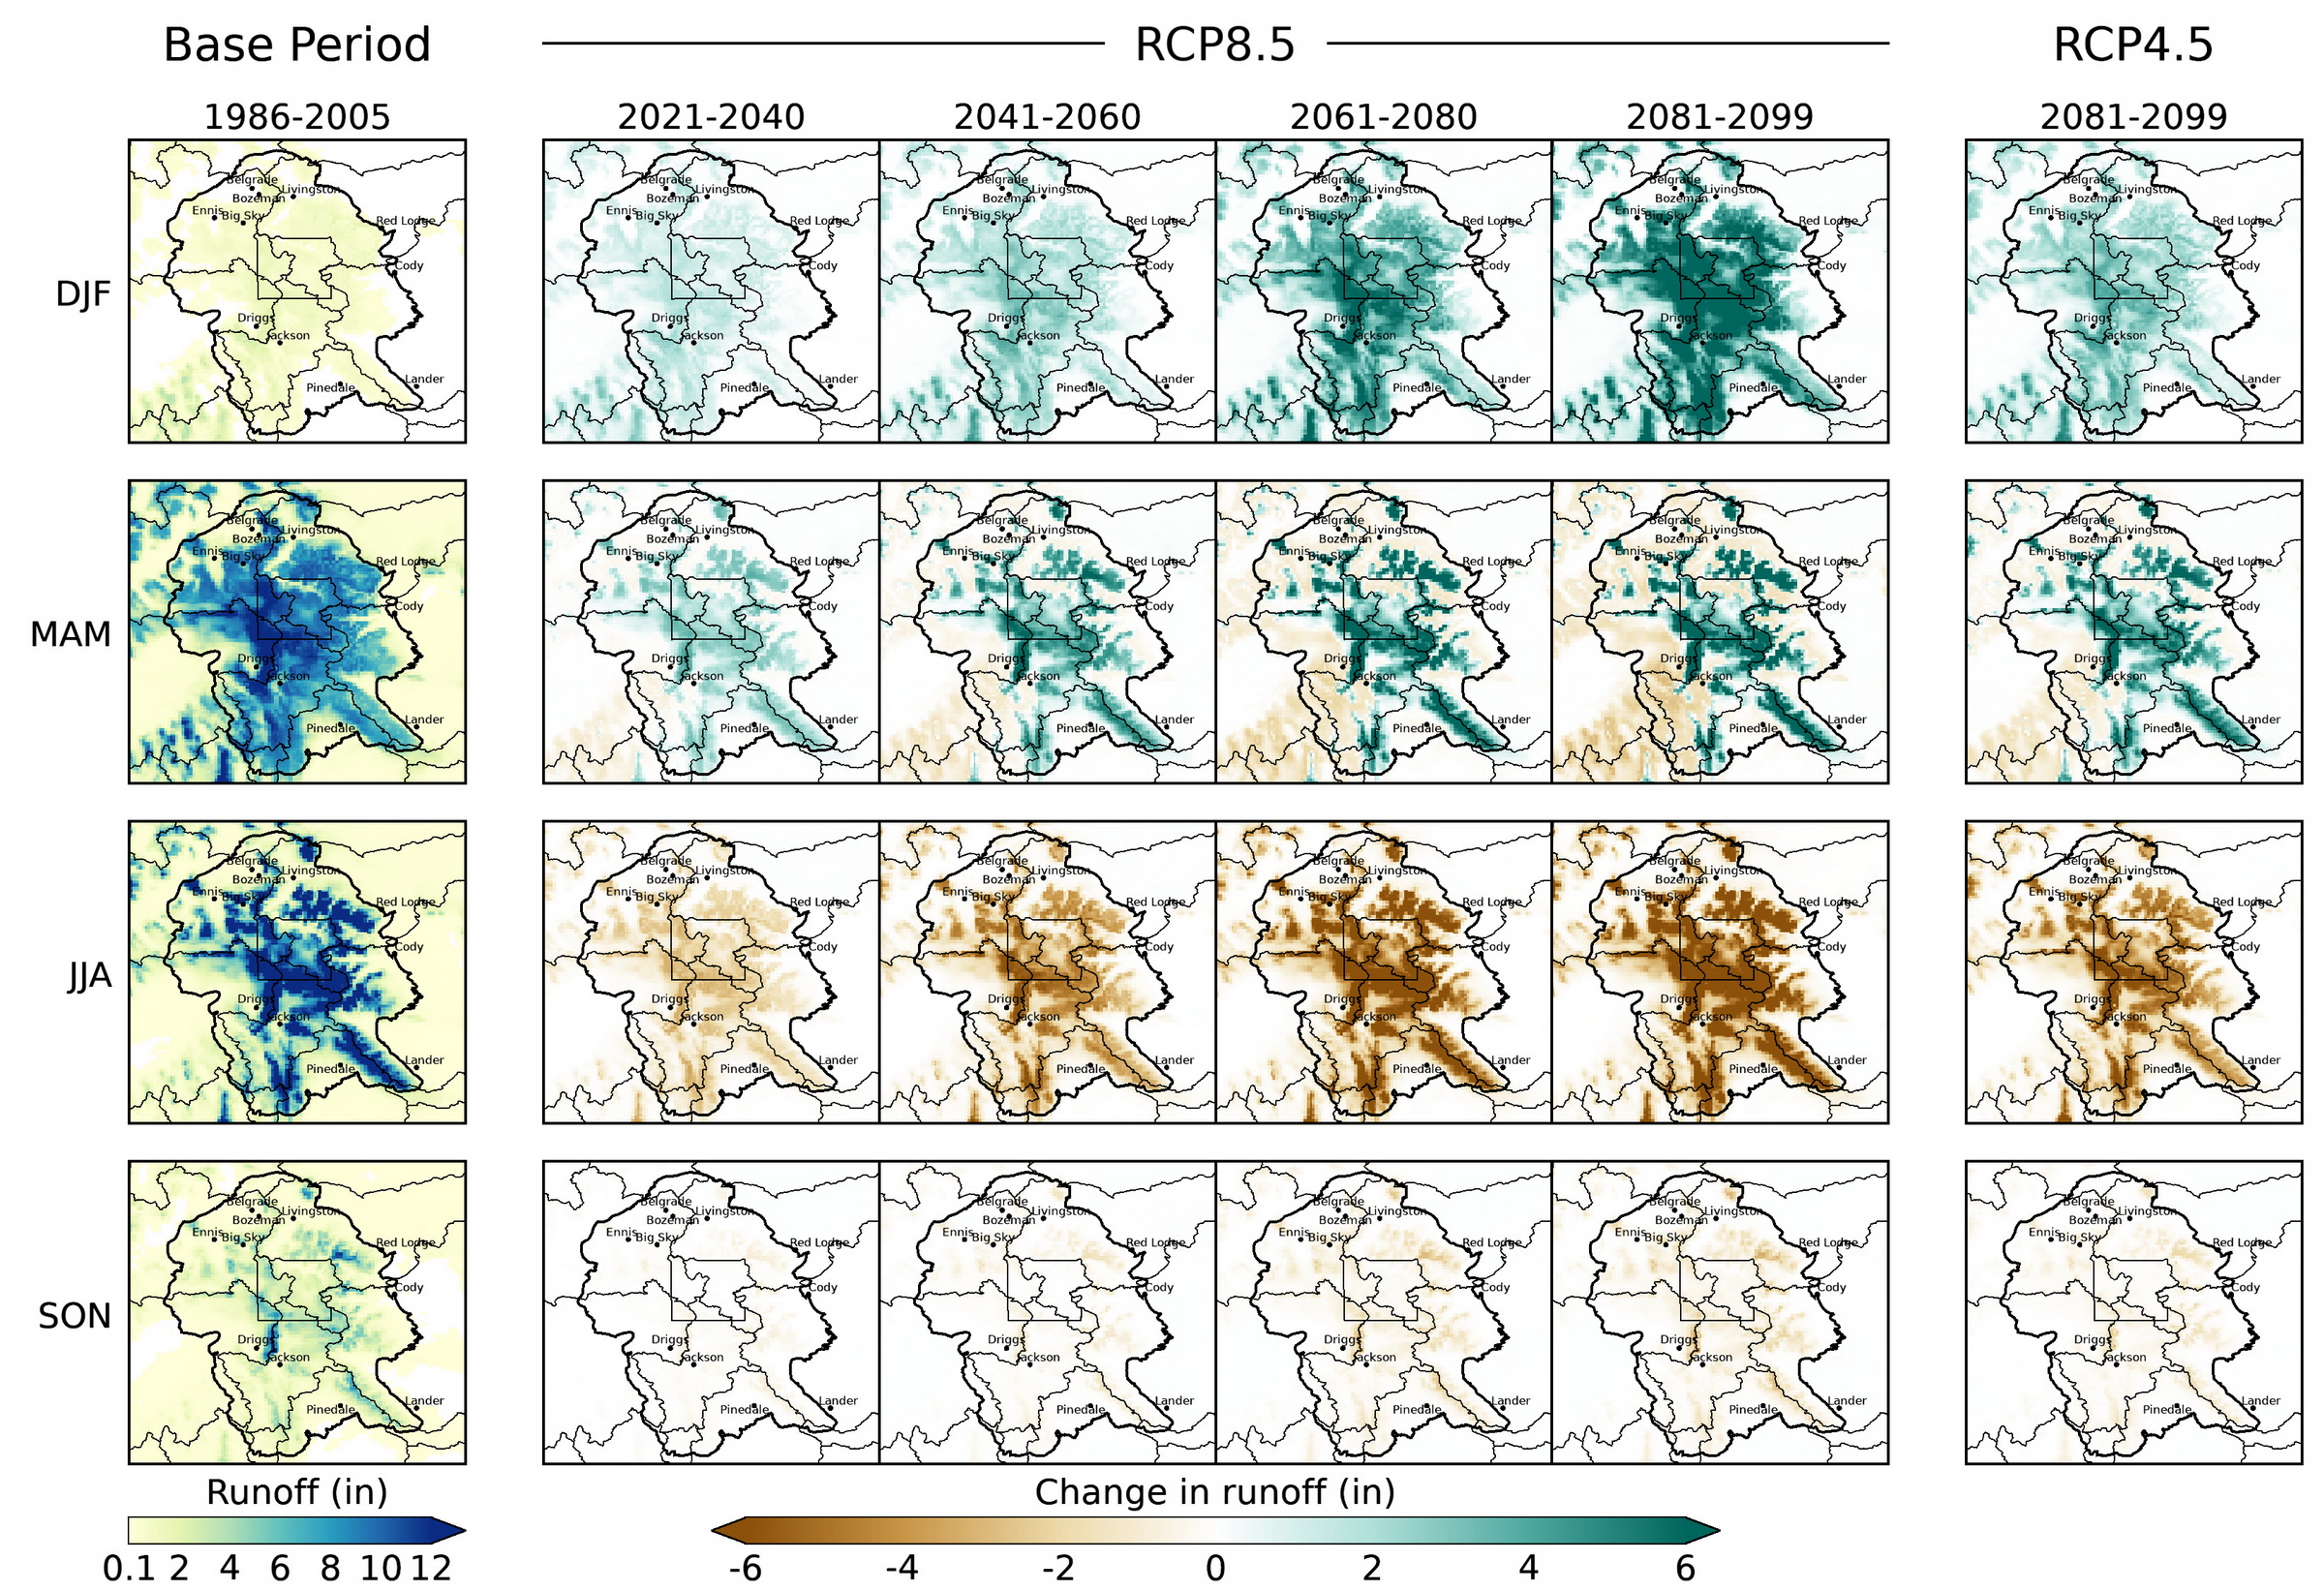
Figure A7-2. Seasonal mean runoff in the Greater Yellowstone Area for the 1986-2005 base period (left column), changes under Representative Concentration Pathway 8.5 (RCP8.5, four center columns), and changes at the end of the 21st century under RCP4.5 (right column), as simulated by the water balance model. The seasons (e.g., December-February [DJF]) are arranged in rows and the changes relative to the 1986-2005 base period for each future period (e.g., 2021-2040) are in columns. Shown are the 20-model means of the simulations that used MACAv2-METDATA data as model input.
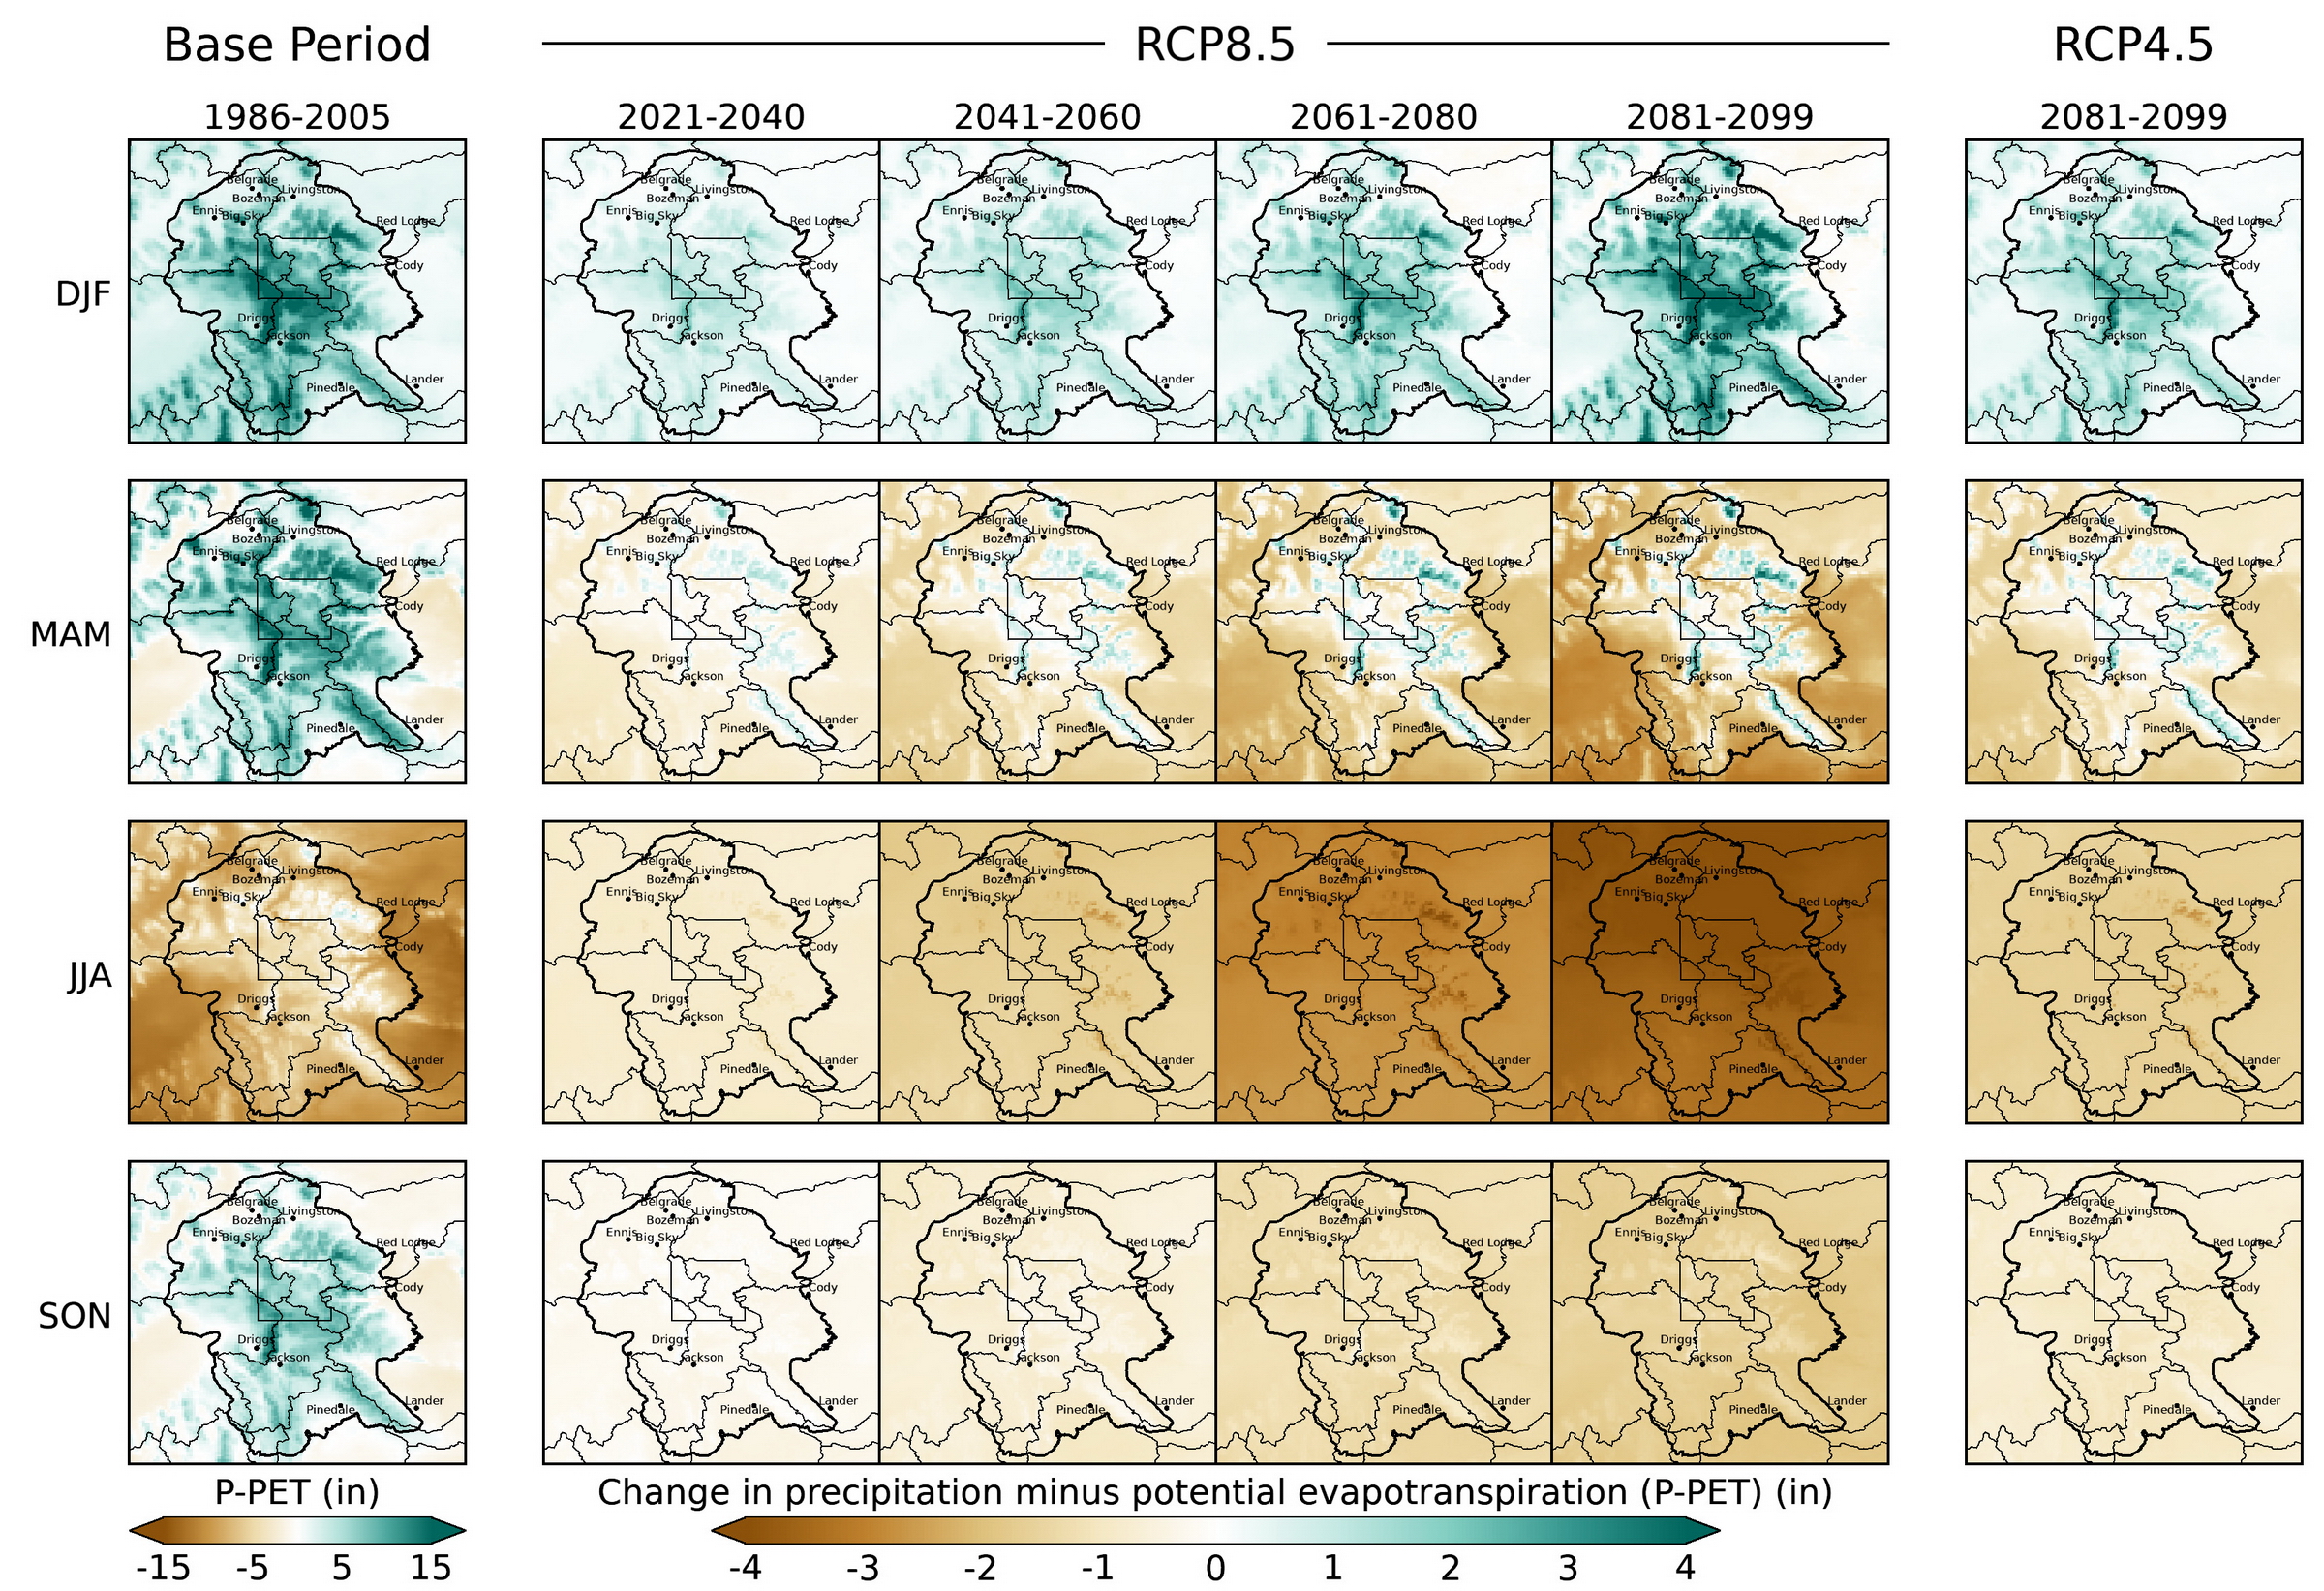
Figure A7-3. Seasonal mean precipitation minus potential evapotranspiration (P-PET) in the Greater Yellowstone Area for the 1986-2005 base period (left column), changes under Representative Concentration Pathway 8.5 (RCP8.5, four center columns), and changes at the end of the 21st century under RCP4.5 (right column), as simulated by the water balance mode. The seasons (e.g., December-February [DJF]) are arranged in rows and the changes relative to the 1986-2005 base period average period for each future period (e.g., 2021-2040) are in columns. Shown are the 20-model means of the simulations that used MACAv2-METDATA data as model input.
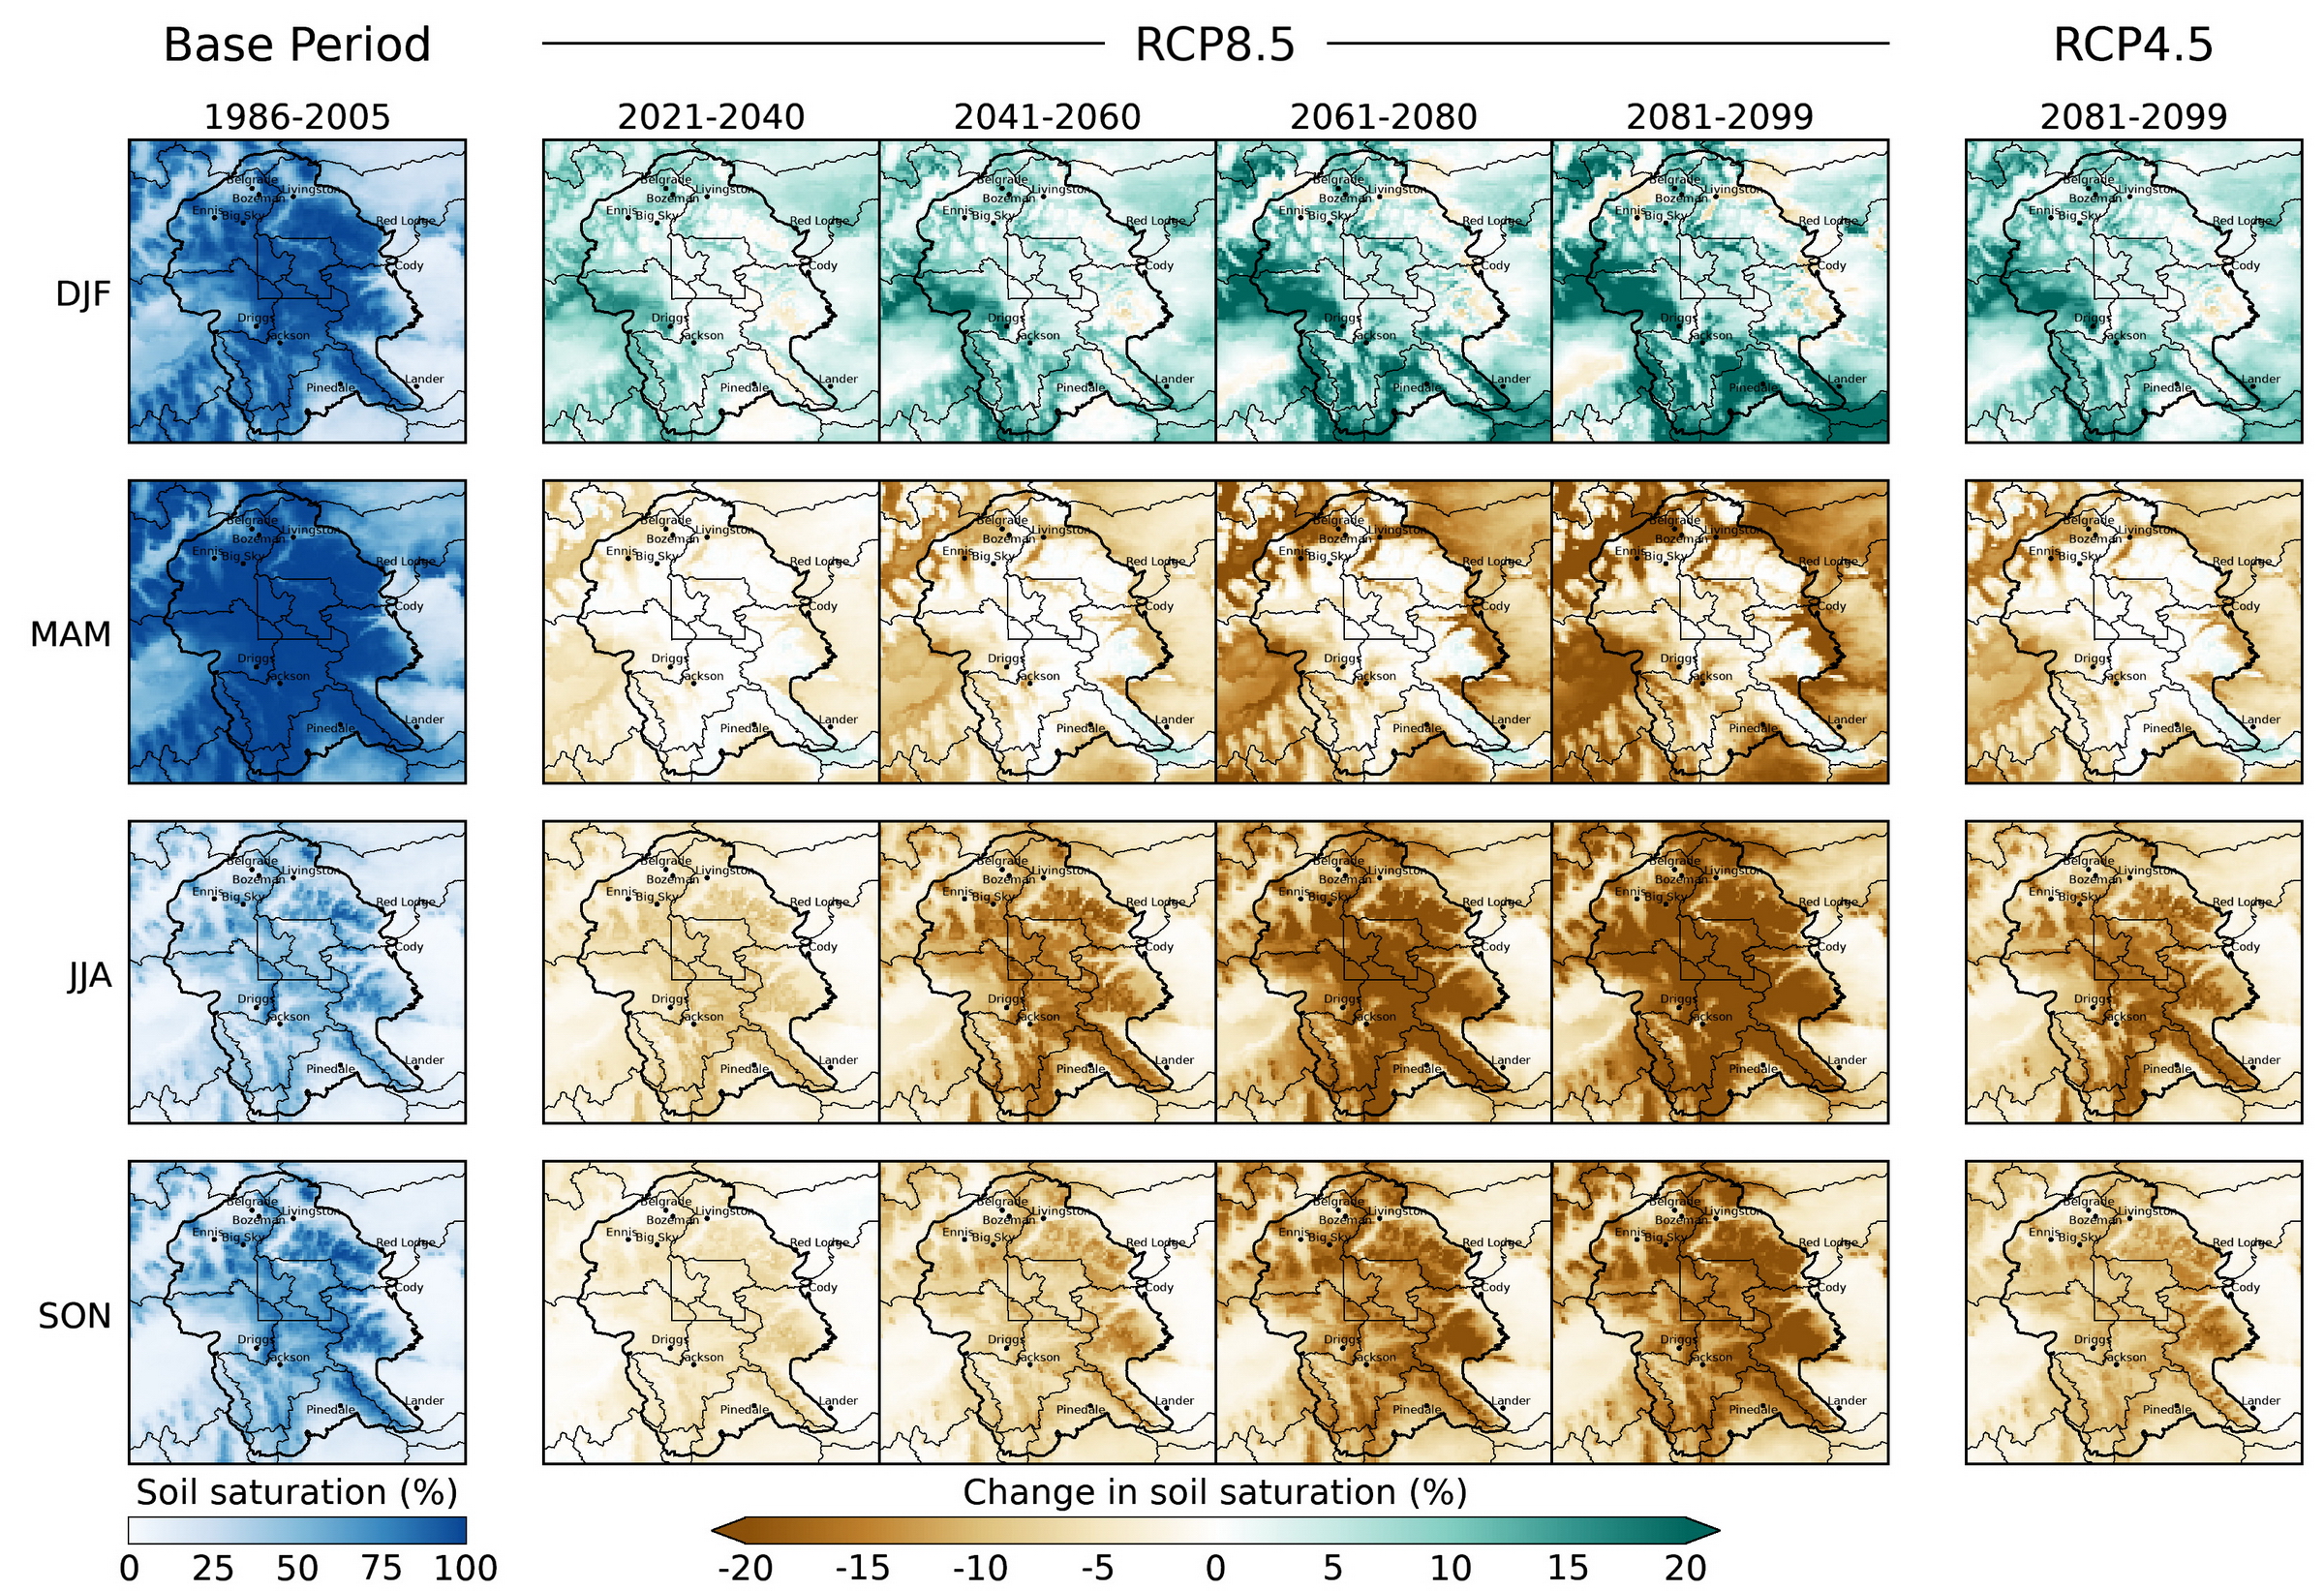
Figure A7-4. Seasonal mean soil moisture saturation in the Greater Yellowstone Area for the 1986-2005 base period (left column), changes under Representative Concentration Pathway 8.5 (RCP8.5, four center columns), and changes at the end of the 21st century under RCP4.5 (right column), as simulated by the water balance model. The values are expressed as percentages relative to full water-holding capacity (100%) of the 1-m (39.4-inch) soil layer used in the model. The seasons (e.g., December-February [DJF]) are arranged in rows and the changes relative to the 1986-2005 base period for each future period (e.g., 2021-2040) are in columns. Shown are the 20-model means of the simulations that used MACAv2-METDATA data as model input.
Literature Cited
Alder JR, Hostetler SW. 2019. The dependence of hydroclimate projections in snow‐dominated regions of the western United States on the choice of statistically downscaled climate data. Water Resources Research 55(3)2279-300. https://doi.org/10.1029/2018WR023458.
Battaglin W, Hay L, Lawrence DJ, McCabe G, Norton P. 2020. Baseline conditions and projected future hydro-climatic change in national parks in the conterminous United States. Water 12(6):1704. doi:10.3390/w12061704.
Conant RT, Kluck D, Anderson M, Badger A, Boustead BM, Derner J, Farris L, Hayes M, Livneh B, McNeeley S, Peck D, Shulski M, Small V. 2018. Northern Great Plains [chapter 22]. In: Impacts, Risks, and Adaptation in the United States: Fourth National Climate Assessment, vol II. In: Reidmiller DR, Avery CW, Easterling DR, Kunkel KE, Lewis KLM, Maycock TK, Stewart BC, editors. Washington DC: US Global Change Research Program. p 941–86. https://doi.org/10.7930/NCA4.2018.CH22.
Gray ST, McCabe GJ. 2010. A combined water balance and tree ring approach to understanding the potential hydrologic effects of climate change in the central Rocky Mountain region. Water Resources Research 46(5). doi:10.1029/2008wr007650.
Hostetler SW, Alder JR. 2016. Implementation and evaluation of a monthly water balance model over the US on an 800-m grid. Water Resources Research 52(12):9600-20. doi:10.1002/2016WR018665
Klos PZ, Link TE, Abatzoglou JT. 2014. Extent of the rain-snow transition zone in the western US under historic and projected climate. Geophysical Research Letters 41:4560-8.
Lackner CP, Greets B, Wang Y. 2021 (Mar 19). Impact of global warming on snow in ski areas: a case study using a regional climate simulation over the interior western United States Journal of Applied Meteorology and Climatology. Available online only. doi:10.1175/JAMC-D-20-0155.1.
Li DY, Wrzesien ML, Durand M, Adam J, Lettenmaier DP. 2017. How much runoff originates as snow in the western United States, and how will that change in the future? Geophysical Research Letters 44:6163-72.
Livneh B, Badger AM. 2020. Drought less predictable under declining future snowpack. Nature Climate Change 10:452-8.
Mantua N, Tohver I, Hamlet A. 2010. Climate change impacts on streamflow extremes and summertime stream temperature and their possible consequences for freshwater salmon habitat in Washington State. Climatic Change 102:187-223.
McCabe GJ, Betancourt JL, Pederson GT, Schwartz MD. 2013. Variability common to first leaf dates and snowpack in the western conterminous United States. Earth Interact 17(26):1-18. doi:10.1175/2013ei000549.
McCabe GJ, Markstrom SL. 2007. A monthly water-balance model driven by a graphical user interface. US Geological Survey open-file report 2007-1088. Reston VA: USGS. 12 p. Available online https://pubs.usgs.gov/of/2007/1088/pdf/of07-1088_508.pdf. Accessed 10 Mar2021.
McCabe GJ, Wolock DM. 2011a. Independent effects of temperature and precipitation on modeled runoff in the conterminous United States. Water Resources Research 47(11). https://doi.org/10.1029/2011WR010630.
McCabe GJ, Wolock DM. 2011b. Century-scale variability in global annual runoff examined using a water balance model. International Journal of Climatology 31(12):1739-48. https://doi.org/10.1002/joc.2198.
McCabe GJ, Wolock DM. 2015. Variability and trends in global drought. Earth and Space Science 2(6):223-8. doi:10.1002/2015ea000100.
Musselman KN, Lehner F, Ikeda K, Clark MP, Prein AF, Liu C, Barlage M, Rasmussen R. 2018. Projected increases and shifts in rain-on-snow flood risk over western North America. Nature Climate Change 8:808-12. https://doi.org/10.1038/s41558-018-0236-4.
[NOAA-NCEI] National Oceanic and Atmospheric Administration-National Centers for Environmental Information. [undated]. Drought—June 2012 [webpage]. Available online https://www.ncdc.noaa.gov/sotc/drought/201206. Accessed Feb 2021.
Oudin L, Hervieu F, Michel C, Perrin C, Andréassian V, Anctil F, Loumagne C. 2005. Which potential evapotranspiration input for a lumped rainfall-runoff model? Part 2 – Towards a simple and efficient potential evapotranspiration model for rainfall-runoff modelling. Journal of Hydrology 303(1-4):290-306.
Pavelsky TM, Sobolowski S, Kapnick SB, Barnes JB. 2012. Changes in orographic precipitation patterns caused by a shift from snow to rain. Geophysical Research Letters 39(18). https://doi.org/10.1029/2012GL052741.
Pederson GT, Betancourt JL, McCabe GJ. 2013. Regional patterns and proximal causes of the recent snowpack decline in the Rocky Mountains, US. Geophysical Research Letters 40(9):1811-6. doi:10.1002/Grl.50424.
Pederson GT, Gray ST, Woodhouse CA, Betancourt JL, Fagre DB, Littell JS, Watson E, Luckman BH, Graumlich LJ. 2011. The unusual nature of recent snowpack declines in the North American Cordillera. Science 333:332-5.
Queen LE, Mote PW, Rupp DE, Chegwidden O, Nijssen B. 2021. Ubiquitous increases in flood magnitude in the Columbia River basin under climate change. Hydrology and Earth System Science 25(1):257-72. doi:10.5194/hess-25-257-2021.
Schwarz GE, Alexander RB. 1995. State Soil Geographic (STATSGO) data base for the conterminous United States. US Geological Survey open-file report 95-449. Reston VA: USGS. doi:10.3133/ofr95449.
Serreze MC, Clark MP, Armstrong RL, McGinnis DA, Pulwarty RS. 1999. Characteristics of the western United States snowpack from snowpack telemetry (SNOTEL) data. Water Resources Research 35(7):2145-60. https://doi.org/10.1029/1999WR900090.
Sproles EA, Roth TR, Nolin AW. 2017. Future snow? A spatial-probabilistic assessment of the extraordinarily low snowpacks of 2014 and 2015 in the Oregon Cascades. The Cryosphere 11:331-41. https://doi.org/10.5194/tc-11-331-2017.
Tennant CJ, Crosby BT, Godsey SE. 2015. Elevation-dependent responses of streamflow to climate warming. Hydrological Processes 29(6):991-1001. doi:10.1002/hyp.10203
Tercek MT, Rodman AW. 2015. Forecasts of 21st-century snowpack and implications for snowmobile and snowcoach use in Yellowstone National Park. PLOS One 11. https://doi.org/10.1371/journal.pone.0159218.
Tercek MT, Rodman AW, Thoma D. 2015. Trends in Yellowstone snowpack. Yellowstone Science 23(1):20-7.
Viger RJ, Bock AR. 2014. GIS features of the geospatial fabric for national hydrologic modeling [webpage]. US Geological Survey data source. Available online https://data.usgs.gov/datacatalog/data/USGS:581a11f0e4b0bb36a4ca2dfc. Accessed 10 Mar 2021 doi:10.5066/F7542KMD
Watson FGR, Anderson TN, Newman WB, Cornish SS, Thein TR. 2008. The ecology of large mammals in central Yellowstone: sixteen years of integrated field studies, vol 3. P 85-112. Cambridge MA: Academic Press. doi:10.1016/S1936-7961(08)00206-6.
Whitlock C, Cross W, Maxwell B, Silverman N, Wade AA. 2017. 2017 Montana Climate Assessment. Bozeman and Missoula MT: Montana State University and University of Montana, Montana Institute on Ecosystems. 318 p. doi:10.15788/m2ww8w.
Wolock DM. 1997. STATSGO soil characteristics for the conterminous United States. US Geologic Survey open-file report 97-656. Reston VA: USGS. doi:10.3133/ofr97656.
Wolock D, McCabe G. 1999. Explaining spatial variability in mean annual runoff in the conterminous United States. Climate Research 11:149-59.
Yellowstone Lake was once covered by an ice cap. Photo courtesy of Cathy Whitlock.